Monthly Archives: September 2012

Hairstyles And Hair Tips For Men And Women To Look Taller

This is one of those posts that is used to help you LOOK taller, and when it comes down to real life application, much easier to implement that any real height increasing procedures. It is too bad there really is not that much information that I could find that talks about how to look taller from using hair styles or tips. The general conclusion is to make the sides of the head short and keep the top of the head grown out and extended up.

From the Daily Makeover website HERE

The Shorter Haircut Can Make You Look Taller

If you’re petite and wish to look taller, consider ashort haircut. That may sound counterintuitive, but Scrivo explains: “A petite woman who wears her hair very long can seem even smaller in stature because the scale of the hair is not proportionate and overwhelming to her figure. If the hair were shorter, the focus would move up toward the face and visually lift up a petite frame.” Vanessa Hudgens is a great example. See how she looks taller with a shorter hair?

From WikiHow.com

Advice for Women

  1. Keep your hair short. Long hair can “drown” shorter women. A hairstyle that stops above the shoulder prevents a woman’s locks from overwhelming her entire stature.
  2. Put your hair up. If you prefer long hair, consider putting it back in high ponytails, buns, and other up-do’s. Hair that extends several inches above the head adds inches to your height. Moreover, keeping your hair back prevents you from “drowning” in it.
Add layers or highlights to your locks. Long, straight hair that hangs down in a single layer has the most overwhelming effect. Adding choppy layers or highlights breaks up the monotony of long hair, which may help prevent it from dwarfing you.

Advice for Men

  1. Add height to your hairstyle. Keep the sides of your hair neatly trimmed, but leave plenty of hair on top. The extra volume on top, when matched with the decreased volume on the side, adds inches to your overall height. This trick works especially well if you use gel to create a spiky style.


Is A Swimmer’s Build Or Swimmer’s Body The Ideal Body Type?

I remember writing a post a while back where the talk was about the different types of body types. There is the ectomorphic body type, the endomorphic body type, and the mesomorphic body type. I ended the post wondering whether one would rather have the ectomorphic or endomorphic body types.

I would guess most people who read this site are male so most guys would rather have the third option which is the mesomorphic body type. The mesomorph has a naturally athletic build, which means they gain muscle easily and loss wight easily too. Their bodies are rectangular but have wide broad shoulders, creating a v- shaped torso.

Now, to have that type of body for a endomorph which gains fat easily and has trouble gaining muscle, the key is to change one’s diet to more proteins, and put them on a more aerobic exercise program which combines cardio with weights. This gets them to slim down but also bulk up on muscle.

For the ectomorph to gain the athletic build, they really have to focus on eating more proteins and try to do anaerobic, high intensity, low reps weight training. The shoulders need to be widened and the limbs will need to be thicken and have more toned definition.

If one wanted a more simple and easier option to move toward the mesomorphic body type, they can try high intensity and long duration swimming. Swimming has been shown and talked a lot by trainers and exercise experts. In terms of the old model of calorie burning, swimming is ranked as one of the highest ways of exercise to burn calories. To stay constantly above the surface of the water for breath, one must always be moving one’s limbs and body. The consistent movement means the muscles are always being worked.

In addition, the cold temperature of the water can actually act as a energy or heat sink. From thermodynamics, the calories we take into the body has a large portion used to just raise the tempereature of the body to a homeostatic state. One of the ways we can lose calories faster is being in a medium or place that has a lower temperature. The larger the temperature difference between the internal temparture of our bodies and the average temperature of our sorroundings, mean the larger the rate of energy lose happens. Since one type of energy is heat, the heat is just calories used up. The calories used up can be from either the carbohydrates to glucose in our bood stream or the fat stored in our bodies which had long ago been used to keep us warm and be used as energy reserves during times of famine.

Thus, the act of swimming helps us decrease the fat in our bodies, use up calories, and lose weight. Over time, the muscles in certain parts of the body begin to become very developed. The body actually sort of goes through a transformation.

Traditionally, the swimmers build has been described as have a v-shaped torso, with broad wide shoulders, well defined upper torso pecs, flat but toned stomach, and thin waist. The upper legs and calves are also thin and toned from kicking. The arms are thick and very toned as well. There is always still a layer of fat left but that helps in giving the body a more natural look than being completely defined and cut which is 0% body fat free.

The body type most resemble the mesomorphic form, but also slightly more on the ectomorphic side in certain areas. People who have swimmers builds are often described as being tall, even thought they may not actually be. The shape of the torso may create the subtle illusion that the person may be slightly taller than they really are, from being thin/ ectomorphic is certain places.

If one wanted to try to change their body through exercise to look taller, instead of just fasting to look more ectomorphic, which makes them thinner, they can also go for the swimmers build. The exercise is recommended by most doctors for its low impact on the joints, it ability to burn calories, and its aerobic benefits. The heart ia often pushed quite hard when the person first takes up swimming and the person finds themselves out of breathe. Afterwards, they may even feel sharp acute pain in their solar plexus area because their diaphragm muscles are actually reacting to the sudden use of them at such a high level. Within 1-2 months, the person will notice their bodies transform and they will feel like they have more energy than before.

In terms of height, as I said before, the shape and form of a swimmer’s build can create the illusion of more height than others. Most people often use the word “tall” to describe a swimmer’s build. It is desired the most by women for the type of body they would like to have for their male partners. In general, the swimmer’s build or swimmers body is viewed in a very positive light by many people.

But is it really the ideal body type?


The Real Correlation Between Milk, Calcium, Bone Growth, And Height

There a an age old myth that states that if one drink a lot of milk when one is young, one will grow up to be tall and strong. The general public’s knowledge goes along like “milk has calcium, which is critical to make strong bones. If you get enough calcium from drinking milk, you will increase the rate of your growth and the final height you attain.” The theory around valid but from my research throughout the studies, some have stated that calcium does nothing towards one’s final height attained, but is actually used to make the bones stronger and more dense, not longer.

Let’s just see what the studies really state.

From the website for The Journal Of Endocrinology and Metabolism article entitled “Height and Height Z-Score Are Related to Calcium Absorption in Five- to Fifteen-Year-Old Girls” (Source HERE)…

Abstract

Context: Understanding the relationship between calcium absorption and growth has been limited. We have developed a database of calcium absorption measurements in 315 girls aged 5.0–15.0 yr.

Design: We have used this database to assess the relationship between height, its age- and gender-normalized value (height Z-score), and calcium absorptive efficiency.

Results: Overall, height was significantly related to calcium absorption (corrected for calcium intake, age, Tanner, stage, and ethnicity) (P = 0.001). Similarly, height Z-score was significantly related to calcium absorption (P < 0.007). About 3–3.5% of the variability (η2) of absorption was associated with height or height Z-score. We found that calcium absorption was significantly lower in girls with height Z-score equal to or less than zero compared with those with a height Z-score more than zero (difference, 3.9 ± 1.4%, mean ± SEM; P = 0.007). Limiting the analysis to those girls in which Tanner staging was performed or those age 9 yr or older did not substantively affect these relationships.

Conclusion: These results indicate that a small but significant component of the variability in calcium absorption is due to height. Identifying genetic risk factors for lowered calcium absorption during growth could lead to individual approaches for prevention of inadequate bone mass.

THE RAPID ACQUISITION of bone mineral during pubertal growth usually appears to be supported by an increased absorption of dietary calcium rather than an increased intake of dietary calcium or decreased excretion of calcium (1, 2). This regulatory adaptation is similar to that which occurs during pregnancy and is dependent on an adequate vitamin D status (3, 4). We have demonstrated that a specific polymorphism of the vitamin D receptor Fok1 gene was highly related to calcium absorption in pubertal children (5, 6). Our data further suggested a link between calcium absorption and height during growth, but the database was too small and too limited in age range to clearly identify this relationship (6).

Although it is reasonable to hypothesize that dietary calcium absorptive efficiency during childhood and adolescence is partly regulated by the body’s need for calcium to support longitudinal growth, no data demonstrate this relationship. This is due to the relatively small scale and limited accuracy of many calcium balance studies done before 1950 (1) and the small number of studies performed since then using more accurate techniques (7, 8).

Recently, the importance of understanding this relationship has increased due to confusing data regarding the effects of calcium supplementation in children. Several studies have failed to find benefit to supplementation over a long period of time, especially after the supplements were stopped (9, 10, 11). The longest supplementation study (9) found that a benefit to calcium supplementation was present only for those girls whose height was greater (after the end of their growth phase) than average for the study population. Although previous studies had demonstrated a link between milk supplementation and longitudinal growth, such studies generally were performed in subjects at risk for growth failure or with very low calcium intakes (12, 13, 14).

We have conducted studies of calcium absorption in girls at a single medical center using the reference dual-tracer stable isotope method for more than 13 yr. Most of our studies have involved no interventions other than manipulation of calcium intake and have used virtually identical dietary and absorptive measurement methods. Our database of absorptive measurements is larger than recent studies using reliable methodologies (7, 15). We have pooled the data from our studies for this analysis with the intent of specifically identifying the relationship during growth between calcium absorption and height. We hypothesized that the genetic growth potential, as assessed by the height Z-score, would be significantly related to calcium absorption during growth.

Discussion

Achieving peak bone mass in adolescence is believed to be an important aspect of reducing the ultimate risk of osteoporosis ). Therefore, because urinary calcium excretion slightly increases during puberty, adaptation to meet bone mineral accretion needs must come via increasing the proportion of dietary calcium that is absorbed, i.e. increasing calcium absorptive efficiency.

Our finding of a significant relationship between height Z-score (and height) and calcium absorptive efficiency demonstrates that the increase in absorptive efficiency is partly regulated to meet the needs of the ultimate skeletal size. Height is a highly heritable characteristic that demonstrates close tracking during puberty (28, 29). By using the height Z-score in this analysis, we specifically identified the effects on calcium absorption of being above or below the average population height. Although the percentage of absorptive efficiency variation accounted for by height or its Z-score was small (3–3.5%), this relationship has not been identified previously and was comparable in magnitude with the variation accounted for by previously identified factors such as age and calcium intake. Furthermore, the differences in calcium absorptive efficiency between those with height Z-scores equal to or less than 0 and those with height Z-scores more than 0 of 3.9% would represent a substantial distinction close to that of the increase of calcium absorptive efficiency during early puberty (20).

As expected, Tanner stage was significantly correlated to calcium absorption (Table 1⇑); however, this was not significant when height Z-score rather than actual height was used as the covariate. Although it is apparent that pubertal progression affects calcium absorption efficiency (7), there remains a significant relationship between height and its Z-score and calcium absorption efficiency when pubertal stage is considered.

We did not assess the relationship between calcium absorption efficiency and bone mineralization. Bone mineralization data were not available for many of the subjects in this study. For one of the individual studies that provided 50 subjects to this database, total body bone mineral content Z-scores were available. For these subjects, when combined with 49 boys of similar ages (6), we found a marginal significant relationship between whole body bone mineral content and height Z-score (P = 0.09) (Abrams, S. A., unpublished observation). This lower significance may be related to the smaller sample size and inclusion of males and females but may also reflect the multiple other factors, such as body weight, that are associated with bone mineralization.

Bone mineralization is highly dependent on weight as well as height during childhood (12, 30, 31), and we did not find a significant relationship between weight when used as a covariate with height and calcium absorptive efficiency. Furthermore, the optimal measures of bone mineral status during childhood and adolescence are unclear, and large database Z-score data are not available for whole body or regional bone mineral content (or density) in pediatric populations compared with the well-established globally derived height Z-score data. It is reasonable to hypothesize that calcium absorption efficiency during growth is more closely related to height than bone mineral content, but this would require additional investigation.

The mechanism by which height and height Z-score is related to calcium absorption efficiency is uncertain. Our findings support a genetic component regulating calcium absorption efficiency during childhood, a finding consistent with identified genetic effects such as differences between males and females in skeletal calcium accretion during puberty (30, 31) and ethnic differences in calcium absorption (15). Additional evidence for a genetic regulation of calcium absorptive efficiency is our finding that a specific polymorphism of vitamin D receptor, the Fok1 genotype, was significantly related to both calcium absorption and bone mineralization in a group of pubertal boys and girls (5, 6).

It is also possible that a significant aspect of this relationship is attributable directly to the larger intestinal surface of taller individuals. This is consistent with the findings that a relationship between calcium absorption and height is present as well in adults (Heaney, R. P., personal communication). However, our dataset of growing children in which absorption is linked to both height and height Z-score, but less so with chronological age, suggest a genetic component as well, at least during growth.

Although it has been known for many years that increased calcium intake, such as by milk drinking (13, 14), is associated with an increase in height, such data were collected mostly on individuals with very low calcium intakes or significant malnutrition. Also, results conflict over the benefits of high calcium intakes and even milk drinking for ultimate bone mass in adolescents (32). Several recent studies have not confirmed a substantial long-term benefit to calcium supplementation for increasing bone mineral density (9, 10, 11, 32). One recent study demonstrated that calcium supplementation above a baseline of 800 mg/d enhanced bone mineral density in girls who were above the average height of the group but not for those who were below the average height (9).

Clearly, an adaptive mechanism of increased calcium absorptive efficiency could be inadequate to meet the needs of very tall individuals or those with a severely deficient calcium intake, especially over a prolonged period of time (22). However, the results of recent controlled trials generally suggest that adequate mineralization of the skeleton does not require very high calcium intake levels during growth (11, 32). The ability to adapt calcium absorptive efficiency to biological needs for calcium is likely part of the reason that more moderate calcium intakes are adequate even during pubertal growth (9, 11, 32). Subjects with underlying health problems such as malabsorptive states may not adapt well, however, and could require higher intakes of calcium and vitamin D.

In summary, using a large database of clinical studies, we demonstrated that height and its age- and gender-normalized Z-score are significant predictors of calcium absorptive efficiency in girls during childhood and early adolescence. These findings further support the concept of genetic regulation of calcium absorptive efficiency, especially in supporting skeletal growth. Ultimately, individual risk profiles based on a variety of factors (e.g. gender, parental height, medical conditions, genetic polymorphisms, and family history of osteoporosis) might be used to establish individual risk analyses by which appropriate monitoring and intervention can be proposed at an early age.

Me: In another article written and posted on PubMed on the website for US National Library of Medicine , National Institute of Health (source HERE).

Calcium supplements in healthy children do not affect weight gain, height, or body composition.

Winzenberg T, Shaw K, Fryer J, Jones G.

Source

Menzies Research Institute, Private Bag 23, Hobart, TAS 7001 Australia. tania.winzenberg@utas.edu.au

Abstract

OBJECTIVE:

Calcium intake is a potential factor influencing weight gain and may reduce body weight, but the evidence for this in children is conflicting. The aim of this study was to use data from randomized controlled trials to determine whether calcium supplementation in healthy children affects weight or body composition.

RESEARCH METHODS AND PROCEDURES:

This study is a systematic review. We identified potential studies by searching the following electronic bibliographic databases: CENTRAL, MEDLINE, EMBASE, CINAHL, AMED, MANTIS, ISI Web of Science, Food Science and Technology Abstracts, and Human Nutrition up until April 1, 2005 and hand-searched relevant conference abstracts. Studies were included if they were placebo-controlled randomized controlled trials of calcium supplementation, with at least 3 months of supplementation, in healthy children and with outcome measures including weight. Meta-analyses were performed using fixed effects models and weighted mean differences for weight and height and standardized mean differences (SMDs) for body composition measures.

RESULTS:

There were no statistically significant effects of calcium supplementation on weight [+0.14 kg; 95% confidence interval (CI), -0.28, +0.57 kg], height (+0.22 cm; 95% CI, -0.30, +0.74 cm), body fat (SMD, +0.04; 95% CI, -0.08, +0.15), or lean mass (SMD, +0.14; 95% CI, -0.03, +0.31).

DISCUSSION:

There is no evidence to support the use of calcium supplementation as a public health intervention to reduce weight gain or body fat in healthy children. Although our results do not rule out an effect of dietary supplementation with dairy products on weight gain or body composition, there is little evidence to support this hypothesis.

Me: This study suggest that taking calcium supplements does not increase or decrease weight, HEIGHT, or other anthropomorphic measurements. 

From another article post on the American Journal of Clinical Nutrition website located HERE

Does a LOW Intake of CALCIUM Retard GROWTH or Conduce to STUNTEDNESS?

  1. A. R. P. WALKER, M.SC., PH.D., Head of Human Biochemistry Unit

Author Affiliations

  1. Human Biochemistry Unit, South African Institute for Medical Research, Johannesburg, and South African Council for Scientific and Industrial Research
  2. *South African Institute for Medical Research, Johannesburg, and the South African Council for Scientific and Industrial Research.

Abstract

It is widely accepted that in humans a low intake of calcium prejudices the rate of attainment of height and makes for ultimate stuntedness. There are, however, so many factors, dietary and non-dietary, which influence growth, that a precise assessment of the particular role of calcium is well nigh impossible.

Children from poor homes, and probably with a relatively low calcium intake, are certainly inferior in height compared with better class children of the same race and country. In addition, usually, though not invariably, indigenous children from tropical and semitropical countries, habituated to a low intake of calcium, are inferior in height compared with Western children. In neither case, however, is there evidence that differences in calcium intake are specifically implicated.

Where calcium supplements have been fed for short periods to children and youths accustomed to intakes of calcium less than the recommended allowances, there appears to be no critical evidence that these additions have specifically produced increments in height beyond such observed in controls.

The conclusion is reached that it has not been established that calcium intake per se is of importance in regulating height. It is suggested that apart from gross undernutrition, the critical intake of calcium below which retardation of growth occurs, lies below the wide range of calcium contents of everyday diets consumed in different parts of the world.

Me: What is very important to note about this article was that it was written in 1954, almost 60 years ago so the information and data may be completely different now.

On the Lifesource 4 Life website HERE

Calcium—Good for Teen Growth and Bone Building

Healthnotes Newswire (December 8, 2005)—Teenage boys can increase their bone-mineral content and their height by taking a calcium supplement, according to the Journal of Clinical Endocrinology and Metabolism (2005;90:3153–61).

Osteoporosis is a major contributor to health problems in older people. The severely low bone density that characterizes osteoporosis increases the risk of fractures, which can lead to immobility and complicated recovery that can even result in death. Osteoporosis prevention has a two-pronged approach: maximizing the bone density at the time in life when it reaches its peak (about 25 years old) and minimizing bone loss in later life. A number of nutrients can influence bone density by stimulating proper use of calcium by the body; however, adequate calcium intake and exercise remain the cornerstones of osteoporosis prevention. Several studies have found that supplementing with calcium before and around the time of puberty can lead to increased bone-mineral density. Little is known about the effects of calcium supplementation in adolescents who are past puberty.


In the current study, 143 healthy boys between the ages of 16 and 18 were randomly assigned to take either a calcium supplement (500 mg twice per day in the form of calcium carbonate) or a placebo for 12 months. Bone-mineral status, height, and weight were measured at the beginning, middle, and end of the study. It was determined at the end of the study that overall compliance was about 59%; in the calcium group, the intake of supplemental calcium averaged 652 mg per day. Measurements taken at the middle and end of the study showed that the amount of mineral in the bones (bone-mineral content) increased significantly more in the boys taking calcium than in the boys not taking calcium; the difference was greater at the end of the study. In addition, the boys taking calcium grew significantly more in height than the boys who did not take calcium. This difference was 7 mm, or about 0.28 inches. Finally, when activity level was considered, the boys with a high activity level had more bone mass and increased their bone-mineral content more than boys with a low activity level.

The results of this study show that calcium supplementation can lead to an increase in bone-mineral content and an increase in growth in height in adolescent boys. They also add to the evidence that exercise is beneficial for bone-building during adolescence. In a previous study, adolescent girls who were past puberty (ages 16 to 18) experienced an increase in bone-mineral density but did not increase in height more than girls who did not take calcium. Whether these changes in bone density will have a lasting impact on bone health later in life in either gender should be a topic of future research. Additional research should also focus on whether the short-term height gain seen in boys taking calcium will result in them being taller once they reach their maximum height.

Me: from this resource and study, it seems to show that boys who take calcium supplements might be able to increase their height a little, the average of around 0.25 inches.

From another study done and posted on the American Journal of Clinical Nutrition website located HERE entitled “Effect of cow milk consumption on longitudinal height gain in children” Published in 2004.

Black et al (1) studied prepubertal children who had a long history of avoiding consumption of cow milk and found that such children tend to have short stature and high adiposity. Blanaru et al (2) confirmed that dietary arachidonic acid alters bone mass in piglets fed cow milk–based formula. We are very interested in their results because in a previous prospective study, we examined the effect of cow milk consumption on longitudinal height gain in children (3).

The subjects were 122 children (60 boys and 62 girls) aged 9.5 ± 0.2 y ( ± SD). Standing height and weight were measured, and relative weight was obtained according to the standard weight for sex, age, and height. Three years later, we recruited the subjects for the second part of the study, which included anthropometric measurements and the questionnaire about cow milk consumption. The question was “How much cow milk do you usually drink a day?” The possible answers were “<250 mL,” “250–500 mL,” “500–1000 mL,” and “>1000 mL.” We investigated the relation between cow milk consumption and longitudinal changes in height, weight, and relative weight.

Ninety-two children (47 boys and 45 girls; 75.4% of the original sample) volunteered to participate in the second series of examinations. There were no significant differences in mean height, weight, or relative weight between the participants and the nonparticipants at the first examination. The participants were divided into 2 subgroups according to cow milk consumption: high consumption (>500 mL/d; 16.5%) and low consumption (<500 mL/d; 83.5%). The 3-y changes in height, weight, and relative weight in the high- and low-consumption groups were 18.8 ± 0.5 and 21.3 ± 1.1 cm, 13.3 ± 0.5 and 13.3 ± 0.8 kg, and −2.6 ± 0.8% and −5.6 ± 2.9%, respectively. The difference between the 2 groups was statistically significant for height (P = 0.042, Mann-Whitney U test) but not for weight or relative weight.

Several previous studies showed an effect of milk on height gain in pubertal children. In 1984 Takahashi (4) reported an acceleration of growth in Japan from the 1950s and suggested the importance of milk consumption. And this increase in height was prominent during puberty. In a cross-sectional study, Jirapinyo et al (5) reported that milk intake and parents’ height contributed to adolescent height in females. Bonjour et al (6) found that prepubertal girls who consumed a diet including calcium-enriched foods grew in height in a randomized, double-blind, placebo-controlled study. In our longitudinal study, the mean height gain in the high-consumption group was higher than that in the low-consumption group, and the difference in height gain between the 2 groups was 2.5 cm/3 y.

Calcium itself has an important role in bone health, and many studies have shown the contribution of cow milk or dairy products to bone mass and bone mineral content. However, cow milk may have other components that promote bone health. Insulin-like growth factor I, which is present in much higher concentrations in cow milk than in human milk, is important for bone mineral accrual on periosteal surfaces. It is relatively stable to both heat and acidic conditions; therefore, it survives the conditions of commercial milk processing (7). Milk whey protein, especially milk basic protein, was reported to promote bone formation and to suppress bone resorption, and daily supplementation with milk basic protein significantly increases bone mineral density independently of dietary intake of minerals and vitamins (8). In addition, Blanaru et al (2) showed that whole-body bone mineral content was elevated in piglets fed arachidonic acid and that liver arachidonic acid was positively related to plasma insulin-like growth factor I and calcitriol. Furthermore, transforming growth factor β2 was also well preserved in human milk after holder pasteurization at 56.5 °C (9). Transforming growth factor β2 inhibits the differentiation of human adipocyte precursor cells and reduces the activity of the lipogenic enzyme glycero-3-phosphate dehydrogenase (10). This may explain why Black et al (1) found a high proportion of obese children among the milk-avoiding children in their study. In our longitudinal study, the change in relative weight in the high-consumption group was lower than that in the low-consumption group. Cow milk may also have some effect on adipose tissue.

In summary, in our prospective study, we observed a height gain in the children who consumed a high amount of cow milk. Milk is regarded as the best nutritional support for neonatal growth and development. In pubertal children, cow milk may also be an important nutrient for growth and for achieving optimal bone mass to prevent osteoporosis in later life. Finally, height gain in children may depend not only on the calcium in cow milk but also on some of its bioactive components.

Me: Lastly, from another study done looking at the relationship between milk consumption and height, from Pubmed entitled “Adolescent height: relationship to exercise, milk intake and parents’ height.” (source HERE)

J Med Assoc Thai. 1997 Oct;80(10):642-6.

Adolescent height: relationship to exercise, milk intake and parents’ height.

Jirapinyo P, Wongarn R, Limsathayourat N, Maneenoy S, Somsa-Ad K, Thinpanom N, Vorasanta P.

Source

Department of Pediatrics, Faculty of Medicine, Siriraj Hospital, Mahidol University, Bangkok.

Abstract

The investigators studied the height of adolescents in the age range of 12 to 18 years from 2 schools in Bangkok. Questionnaires asking their rates of organised exercise per week, of milk intake per day and their parental heights were given to a total of 545 male and 615 female students. The completed questionnaires were analyzed. We could categorize these subjects into 3 groups according to their heights which were Group I (height > 97th%-ile), Group II (height between 50-97th%-ile) and Group III (height < 50th%-ile). Those in Group I had parents, whose height was significantly greater than those of the other groups. There was no difference in organized exercise among the 3 groups. Milk intake of female adolescents from Group I was significantly more than the other groups. It is concluded that parents’ height in both males and females and milk intake in females contribute to a greater adolescent height.

Conclusion: This is my guess on the effect of milk on height and human growth. I hypothesize that the affect of milk does have a correlation to the growth rate and final height of individuals. However,the affect of milk on height is small. I note that the last study was done in Bangkok, which is still a developing nation so there are many cases of malnutrition. Giving still growing female milk will obviously help their nutrition level and increase their overall height. 

Calcium is needed and used by the bones to make the bone matrix stronger. I would guess that the rate of chondrocydal ossification and calcification would be slower in the plate layers if there is not enough calcium absorbed into the body. Since plates have been shown to have a sort of life span to them, the calcium that is not gotten from poor nutrition means potential height that is lost once the growth plates become too thin or weak.. However, I would guess that getting enough of the absorption of Vitamin D and Calium (about 1000 mg/day) into the bones means that the ossification and calcification layer of the growth plates have increased their reaction rate so that the rate limiting area is not there but more likely in the proliferation or hypertrophy layer. There is possibility a threshold or plateau which milk can affect overall height. Once that is reached, drinking any more milk will only make the bones stronger, but not longer. 

The Composition And Elements Of The Long Bone

What exactly are the components that make up the bone? Since we are looking at increasing the length of long bones, let’s see what the long bone is made of.

We had stated before that there is 2 main types of bone, the cortical and the trabecular. The cortical is stronger and more dense. It forms on the outer area, while the trabecular is softer and more porous and is in the inner area, right next to the inter medullary cavity where the bone marrow is located.

From Wikipedia HERE

“”The majority of bone is made of the bone matrix. It has inorganic and organic parts. Bone is formed by the hardening of this matrix entrapping the cells. When these cells become entrapped from osteoblasts they become osteocytes.

Inorganic

The inorganic composition of bone (bone mineral) is formed from carbonated hydroxyapatite [7][8] (Ca10(PO4)6(OH)2) with lower crystallinity.[7][9] The matrix is initially laid down as unmineralised osteoid (manufactured by osteoblasts). Mineralisation involves osteoblasts secreting vesicles containing alkaline phosphatase. This cleaves the phosphate groups and acts as the foci for calcium and phosphate deposition. The vesicles then rupture and act as a centre for crystals to grow on. More particularly, bone mineral is formed from globular and plate structures,[9][10] distributed among the collagen fibrils of bone and forming yet larger structure.

Organic

The organic part of matrix is mainly composed of Type I collagen. This is synthesised intracellularly as tropocollagen and then exported, forming fibrils. The organic part is also composed of various growth factors, the functions of which are not fully known. Factors present include glycosaminoglycans, osteocalcin, osteonectin,bone sialo protein, osteopontin and Cell Attachment Factor. One of the main things that distinguishes the matrix of a bone from that of another cell is that the matrix in bone is hard. “”

and further…

Paracrine cell signalling

The action of osteoblasts and osteoclasts are controlled by a number of chemical factors that either promote or inhibit the activity of the bone remodeling cells, controlling the rate at which bone is made, destroyed, or changed in shape. The cells also use paracrine signalling to control the activity of each other.

Osteoblast stimulation

Osteoblasts can be stimulated to increase bone mass through increased secretion of osteoid and by inhibiting the ability of osteoclasts to break down osseous tissue.

Bone building through increased secretion of osteoid is stimulated by the secretion of growth hormone by the pituitary, thyroid hormone and the sex hormones (estrogens and androgens). These hormones also promote increased secretion of osteoprotegerin.[15] Osteoblasts can also be induced to secrete a number of cytokines that promote reabsorbtion of bone by stimulating osteoclast activity and differentiation from progenitor cells. Vitamin D, parathyroid hormone and stimulation from osteocytes induce osteoblasts to increase secretion of RANK-ligand and interleukin 6, which cytokines then stimulate increased reabsorbtion of bone by osteoclasts. These same compounds also increase secretion of macrophage colony-stimulating factor by osteoblasts, which promotes the differentiation of progenitor cells into osteoclasts, and decrease secretion of osteoprotegerin.

Osteoclast inhibition

The rate at which osteoclasts resorb bone is inhibited by calcitonin and osteoprotegerin. Calcitonin is produced by parafollicular cells in the thyroid gland, and can bind to receptors on osteoclasts to directly inhibit osteoclast activity. Osteoprotegerin is secreted by osteoblasts and is able to bind RANK-L, inhibiting osteoclast stimulation.[15]

Me: As for the cortical bone areas, they are harder, stronger, stiffer , and make up about 80% of the weight of the bone.

For the cancellous (trabecular) areas of the long bones, they are usually at the end of the long bones, proximal to the joints. Cancellous bone is highly vascular and often contains red bone marrow. The primary anatomical and functional unit of cancellous bone is the trabecula. It refers to the tiny lattice-shaped spicules that form the tissue.

As for the marrow, from Wikipedia HERE, we learn that the marrow…..

is the flexible tissue found in the interior of bones. In humans, red blood cells are produced in the heads of long bones, in a process known ashematopoesis. On average, bone marrow constitutes 4% of the total body mass of humans; in an adult weighing 65 kilograms (140 lb), bone marrow accounts for approximately 2.6 kilograms (5.7 lb). The hematopoietic compartment of bone marrow produces approximately 500 billion blood cells per day, which use the bone marrow vasculature as a conduit to the body’s systemic circulation. Bone marrow is also a key component of the lymphatic system, producing the lymphocytesthat support the body’s immune system.

Marrow types

The two types of bone marrow are medulla ossium rubra (red marrow), which consists mainly of hematopoietic tissue, and medulla ossium flava (yellow marrow), which is mainly made up of fat cells. Red blood cells, platelets and most white blood cells arise in red marrow. Both types of bone marrow contain numerous blood vessels and capillaries. At birth, all bone marrow is red. With age, more and more of it is converted to the yellow type; only around half of adult bone marrow is red. Red marrow is found mainly in the flat bones, such as the pelvis, sternum, cranium, ribs, vertebrae and scapulae, and in the cancellous (“spongy”) material at the epiphyseal ends of long bones such as the femur and humerus. Yellow marrow is found in the medullary cavity, the hollow interior of the middle portion of long bones. In cases of severe blood loss, the body can convert yellow marrow back to red marrow to increase blood cell production.

Stroma

The stroma of the bone marrow is all tissue not directly involved in the primary function of hematopoiesis. Yellow bone marrow makes up the majority of bone marrow stroma, in addition to smaller concentrations of stromal cells located in the red bone marrow. Though not as active as parenchymal red marrow, stroma is indirectly involved in hematopoiesis, since it provides the hematopoietic microenvironment that facilitates hematopoiesis by the parenchymal cells. For instance, they generatecolony stimulating factors, which have a significant effect on hematopoiesis. Cells that constitute the bone marrow stroma are:

  • fibroblasts (reticular connective tissue)
  • macrophages
  • adipocytes
  • osteoblasts
  • osteoclasts
  • endothelial cells, which form the sinusoids. These derive from endothelial stem cells, which are also present in the bone marrow.

Macrophages contribute especially to red blood cell production, as they deliver iron for hemoglobin production.

Bone marrow barrier

The blood vessels of the bone marrow constitute a barrier, inhibiting immature blood cells from leaving the marrow. Only mature blood cells contain the membrane proteins required to attach to and pass the blood vessel endothelium. Hematopoietic stem cells may also cross the bone marrow barrier, and may thus be harvested from blood.

Mesenchymal stem cells

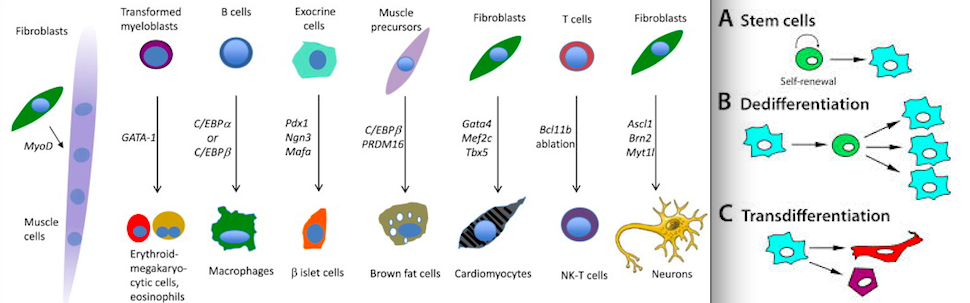
The bone marrow stroma contain mesenchymal stem cells (MSCs), also known as marrow stromal cells. These are multipotent stem cells that can differentiate into a variety of cell types. MSCs have been shown to differentiate, in vitro or in vivo, into osteoblasts, chondrocytes, myocytes, adipocytes and beta-pancreatic islets cells. MSCs can also transdifferentiate into neuronal cells.

From what appears to be a Biomechanics Course from the University of Washington website 

II.         Cortical Bone versus Trabecular Bone Structure

Bone in human and other mammal bodies is generally classified into two types 1: Cortical bone, also known as compact bone and 2) Trabecular bone, also known as cancellous or spongy bone. These two types are classified as on the basis of porosity and the unit microstructure. Cortical bone is much denser with a porosity ranging between 5% and 10%.  Cortical bone is found primary is found in the shaft of long bones and forms the outer shell around cancellous bone at the end of joints and the vertebrae. A schematic showing a cortical shell around a generic long bone joint is shown below:

The basic first level structure of cortical bone are osteons. Trabecular bone is much more porous with porosity ranging anywhere from 50% to 90%.   It is found in the end of long bones (see picture above), in vertebrae and in flat bones like the pelvis. Its basic first level structure is the trabeculae.

III.       Hierarchical Structure of Cortical Bone

As with all biological tissues, cortical bone has a hierarchical structure. This means that cortical bone contains many different structures that exist on many levels of scale. The hierarchical organization of cortical bone is defined in the table below:

                                     Cortical Bone Structural Organization

                        Level               Cortical Structure      Size Range                                                                ____________________________________________________

0                      Solid Material                > 3000 mm                   —

____________________________________________________

1                      Secondary Osteons (A)  100 to 300 mm         < 0.1
Primary Osteons (B)
Plexiform (C)
Interstitial Bone

____________________________________________________

2                      Lamellae (A,B*,C*)     3 to 20 mm                < 0.1
Lacunae (A,B,C,D)
Cement Lines (A)

_____________________________________________________

3                      Collagen-                     0.06 to 0.6 mm         <0.1                                                                                Mineral
Composite  (A,B,C,D)

A – denotes structures found in secondary cortical bone
                             B – denotes structures found in primary lamellar cortical bone
C – denotes structures found in plexiform bone
                               D – denotes structures found in woven bone
* – indicates that structures are present in b and c, but much less than in a

Table 1.      Cortical bone structural organization along with approximate physical scales.
The parameter h is a ratio between the level i and the next most macroscopic level i – 1.
This parameter is used in RVE analysis.

There are two reasons for numbering different levels of microstructural organization.  First, it provides a consistent way to compare different tissues. Second, it provides a consistent scheme for defining analysis levels for computational analysis of tissue micromechanics.  This numbering scheme will later be used to define analysis levels for RVE based analysis of cortical bone microstructure.  The 1st and 2nd organization levels reflect the fact that different types of cortical bone exist for both different species and different ages of different species.  Note that at the most basic or third level, all bone, to our current understanding, is composed of a type I collagen fiber-mineral composite.  Conversely, all bone tissue for the purpose of classic continuum analyses is considered to be a solid material with effective stiffness at the 0th structure.  In other words, a finite element analysis at the whole bone level would consider all cortical bone to be a solid material.

Different types of cortical bone can first be differentiated at the first level structure.  However, different types of first level structures may still contain common second level entities such as lacunae and lamellae.  We next describe the different types of 1st level structure based on the text by Martin and Burr (1989).  As you will see, the different structural organizations at this level are usually associated with either a specific age, species, or both.

III.1       First Level Cortical Bone Structure

there are four types of different organizations at what we have described as the 1st structural level.  These four types of structure are called woven bone, primary bone, plexiform bone, and secondary bone.

III.1.1    Woven-fibered cortical bone

Woven cortical bone is better defined at the 1st structural level by what it lacks rather than by what it contains.  For instance, woven bone does not contain osteons as does primary and secondary bone, nor does it contain the brick-like structure of plexiform bone (Fig. 1).  Woven bone is thus the most disorganized of bone tissue owing to the circumstances in which it is formed.  Woven bone tissue is the only type of bone tissue which can be formed de novo, in other words it does not need to form on existing bone or cartilage tissue.  Woven bone tissue is often found in very young growing skeletons under the age of 5.  It is only found in the adult skeleton in cases of trauma or disease, most frequently occurring around bone fracture sites.  Woven bone is essentially an SOS response by the body to place a mechanically stiff structure within a needy area in a short period of time.  As such, woven bone is laid down very rapidly which explains its disorganized structure.  It generally contains more osteocytes (bone cells) than other types of bone tissue.  Woven bone is believed to be less dense because of the loose and disorganized packing of the type I collagen fibers (Martin and Burr, 1989).  It can become highly mineralized however, which may make it somewhat more brittle than other cortical bone tissue with different level one organization.  Very little is known, however, about the mechanical properties of woven bone tissue.  Christel et al., (1981) suggested that woven bone is less stiff than other types of bone tissue based on the premise that fracture callus is composed mainly of woven bone and is much less stiff than normal bone tissue.  Direct measurements of woven bone tissue stiffness have not been made.

III.1.2    Plexiform Cortical Bone Tissue

Like woven bone, plexiform bone is formed more rapidly than primary or secondary lamellar bone tissue.  However, unlike woven bone, plexiform bone must offer increased mechanical support for longer periods of time.  Because of this, plexiform bone is primarily found in large rapidly growing animals such as cows or sheep.  Plexiform bone is rarely seen in humans.  Plexiform bone obtained its name from the vascular plexuses contained within lamellar bone sandwiched by nonlamellar bone (Martin and Burr, 1989).  In the figure below from Martin and Burr lamellar bone is shown on the top while woven bone is shown on the bottom:

Plexiform bone arises from mineral buds which grow first perpendicular and then parallel to the outer bone surface.  This growing pattern produces the brick like structure characteristic of plexiform bone.  Each “brick” in plexiform bone is about 125 microns (mm) across (Martin and Burr, 1989).  Plexiform bone, like primary and secondary bone, must be formed on existing bone or cartilage surfaces and cannot be formed de novo like woven bone.  Because of its organization, plexiform bone offers much more surface area compared to primary or secondary bone upon which bone can be formed.  This increases the amount of bone which can be formed in a given time frame and provided a way to more rapidly increase bone stiffness and strength in a short period of time.  While plexiform may have greater stiffness than primary or secondary cortical bone, it may lack the crack arresting properties which would make it more suitable for more active species like canines (dogs) and humans.

III.1.3    Primary Osteonal Cortical Bone Tissue

When bone tissue contains blood vessels surrounded by concentric rings of bone tissue it is called osteonal bone.  The structure including the central blood vessel and surrounding concentric bone tissue is called an osteon.  What differentiates primary from secondary osteonal cortical bone is the way in which the osteon is formed and the resulting differences in the 2nd level structure.  Primary osteons are likely formed by mineralization of cartilage, thus being formed where bone was not present.  As such, they do not contain as many lamellae as secondary osteons.  Also, the vascular channels within primary osteons tend to be smaller than secondary osteons. For this reason, Martin and Burr (1989) hypothesized that primary osteonal cortical bone may be mechanically stronger than secondary osteonal cortical bone.

III.1.4    Secondary Osteonal Cortical Bone Tissue

Secondary osteons differ from primary osteons in that secondary osteons are formed by replacement of existing bone.  Secondary bone results from a process known as remodeling.  In remodeling, bone cells known as osteoclasts first resorb or eat away a section of bone in a tunnel called a cutting cone.  Following the osteoclasts are bone cells known as osteoblasts which then form bone to fill up the tunnel.  The osteoblasts fill up the tunnel in staggered amounts creating lamellae which exist at the 2nd level of structure.  The osteoblasts do not completely fill the cutting cone but leave a center portion open.  This central portion is called a haversian canal (see cortical bone schematic).  The total diameter of a secondary osteon ranges from 200 to 300 microns (denoted as mm; equal to 0.2 to 0.3 millimeters).  In addition to osteons, secondary cortical bone tissue also contains interstitial bone, as shown in the cortical bone schematic.

The haversian canal in the center of the osteon has a diameter ranging between 50 to 90 mm.  Within the haversian canal is a blood vessel typically 15 mm in diameter (Martin and Burr, 1989).  Since nutrients which are necessary to keep cells and tissues alive can diffuse a limited distance through mineralized tissue, these blood vessels are necessary for bringing nutrients within a reasonable distance (about 150 mm) of osteocytes or bone cells which exist interior to the bone tissue.  In addition to blood vessels, haversian canals contain nerve fibers and other bone cells called bone lining cells.  Bone lining cells are actually osteoblasts which have taken on a different shape following the period in which they have formed bone.

III.2       Second Level Cortical Bone Structure

The second level cortical bone structure consists of those entities which make up the osteons in primary and secondary bone and the “bricks” in plexiform bone.  Woven bone is again distinguished by the fact that no discernible entities exist at the second structural level.  Within osteonal (primary and secondary) and plexiform bone the four major matrix 2nd level structural entities are lamellae, osteocyte lacunae, osteocyte canaliculi, and cement lines.  Lamellae are bands or layers of bone generally between 3 and 7 mm in thickness.  The lamellae are arranged concentrically around the central haversian canal in osteonal bone.  In plexiform bone the lamellae are sandwiched in between nonlamellar bone layers.  The lamellae in osteonal bone are separated by thin interlamellar layers in which the orientation of bone mineral may be altered.  Lamellae contain type I collagen fibers and mineral.

The osteocyte lacunae and canaliculi are actually holes within the bone matrix that contain bone cells called osteocytes and their processes.  Osteocytes evolve from osteoblasts which become entrapped in bone matrix during the mineralization process.  As such, the size of osteocyte lacunae if related to the original size of the osteoblast from which the osteocyte evolved.  Osteocyte lacunae have ellipsoidal shapes.  The maximum diameter of the lacunae generally ranges between about 10 to 20 mm.  Within the lacunae, the osteocytes sit within extracellular fluid.  Canaliculi are small tunnels which connect one lacunae to another lacunae.  Canalicular processes starting at osteocytes travel through the osteocytes canaliculi to connect osteocytes.  Many people believe that these interconnections provide a pathway through which osteocytes can communicate information about deformation states and thus in some way coordinate bone adaptation. A color view of 2nd level cortical bone structure is shown below (this picture was posted on the website http://medocs.ucdavis.edu/CHA/402/studyset/lab5/lab5.htm, which has a good collection of bone and cartilage histology):

One of the most intriguing 2nd level structural entities from a mechanical point of view is the cement line.  Cement lines are only found in secondary bone because they are the result of a remodeling process by which osteoclasts first resorb bone followed by osteoblasts forming bone.  The cement line occurs at the point bone resorption ends and bone formation begins.  Cement lines are about 1 to 5 microns in thickness.  Cement lines are believed to be type I collagen deficient structures.  Beyond this, the nature of cement has been widely debated.  Schaffler et al. (1987) found that cement lines were less mineralized than the surrounding bone tissue.  Many people have suggested that cement lines may serve to arrest crack growth in bone being that they are very compliant and likely to absorb energy.

III.3       Third Level Cortical Bone Structure

The farther down the hierarchy of cortical bone structure we go, the more sketchy and less quantitative the information.  This is because it becomes more difficult to measure both bone structure and mechanics at increasingly small levels.  Most information about third level cortical bone structure mechanics is based on some quantitative measurements mixed with a great deal more theory.

Third level cortical bone structure may be separated into two basic types, lamellar and woven.  Each type contains the basic type I collagen fiber/mineral composite.  What differentiates these two structures is how the composite, primarily the collagen fibers are organized.  In woven bone, the collagen fibers are randomly organized and very loosely packed.

Lamellar bone, which is found in plexiform, primary osteonal, and secondary osteonal bone, is laid down in a more organized fashion (as seen in the picture above) and constrasts very clearly to the woven bone above..  Although there is probably some continuum of structure between woven and lamellar bone, both bone structure is most frequently organized into these two categories.  The structure of lamellar bone is still widely debated, so we will discuss here the competing theories

III.3.1  Intra and Inter-Lamellar Type I Collagen Orientation

One of the earliest theories to gain acceptance will be denoted here as the parallel collagen fiber orientation theory.  This is based largely on the work of Ascenzi and Bonucci (1970, 1976).  This theory suggests that collagen fibers within the same lamella are predominantly parallel to one another and have a preferred orientation within the lamellae.  The orientation of collagen fibers between lamellae may change up to 90o in adjacent lamellae.

III.4.2  Mineral Packing within Collagen Fibrils

A very thorough review of bone structure (as thorough as possible) from the angstrom level (mineral crystal) to the micron level (lamellae) was recently presented by Weiner and Traub (1992).  In that work, Wiener and Traub reviewed mineral structure, the mineral collagen composite, and how the mineral collagen composite fit into lamellae.  Collagen fibers, with a typical length of 0.015 mm, or .000015 mm, and a length of 3 mm, or .003 mm, packed together form collagen fibrils.  Within the packing of the collagen fibers are distinct gaps sometimes called hole zones (Fig. 14).  The structure of these holes is currently the focus of some debate.  In one model, the holes are completely isolated from each other.  In another model, the holes are contiguous and together from a groove about 0.015 mm thick and .370 mm long.  Within these holes mineral crystals form.  The mineral crystals in final form are believed to be made from a carbonate apatite mineral called dahllite which may initially resemble an octacalcium crystal.  The octacalcium crystal naturally forms in plates.  These mineral plates are typically 0.25 by 0.5 mm in length and width and have a thickness of 0.02 to 0.03 mm. It is these plates which are packed into the type I collagen fibrils.  Because of the nature of the packing, the orientation of the collagen fibrils will determine the orientation of the mineral crystals.

The major difference between trabecular and cortical bone structure is found on the 1st and 2nd structural levels.  It should be noted that the 3rd level of trabecular bone structure is the same (as far as we know) as cortical bone structure.  The major mechanical property differences (as far as we know) between trabecular and cortical bone are the effective stiffness of the 0th and 1st structural level.  Trabecular bone is more compliant than cortical bone and it is believe to distribute and dissipate the energy from articular contact loads.  Trabecular bone contributes about 20% of the total skeletal mass within the body while cortical bone contributes the remaining 80%. However, trabecular bone has a much greater surface area than cortical bone.  Within the skeleton, trabecular bone has a total surface area of 7.0 x 106 mm2 while cortical bone has a total surface area of 3.5 x 106 mm2.  A comparison between the general features of cortical bone and trabecular bone including volume fraction and surface area is given below (Jee,1983):

Structural Feature                                 Cortical Bone                           Trabecular Bone

Volume Fraction                                   0.90 (0.85 – 0.95)                    0.20 (0.05 – 0.60)

(mm3/mm3)

Surface/Bone Volume                           2.5                                           20

(mm2/mm3)

Total Bone Volume                               1.4 x 10^6                                  0.35 x 10^6

(mm3)

Total Internal Surface                            3.5 x 10^6                                  7.0 x 10^6

(mm2)

Table 3.            Comparison of some structural features of cortical and trabecular bone.

IV.1       First Level Trabecular Bone Structure

One of the biggest differences between trabecular and cortical bone is noticeable at the 1st level structure.  As seen in the first table, trabecular bone is much more porous than cortical bone.  Trabecular bone may have bone volume fraction ranging from just over 5% to a maximum of 60%.  Bone volume fraction is defined as the volume of bone tissue (including internal pores like lacunae and canaliculi) per total volume.  The trabecular bone volume fraction varies between different bones, with age, and between species.  The basic structural entity at the first level of trabecular bone is the trabecula.  Trabecula are most often characterized as rod or plate like structures (as seen in these renderings from the website http://www.npaci.edu/envision/v15.3/keaveny.html).

Early finite element models of 1st level trabecular structure did indeed model trabeculae using plate and beam finite elements.  Trabecula are in general no greater than 200 mm in thickness and about 1000 mm or 1 mm long. Unlike osteons, the basic structural unit of cortical bone, trabeculae in general do not have a central canal with a blood vessel.  (Note: we are characterizing the basic or 1st level structural unit of trabecular bone as the trabecula based on the fact that it has similar size ranges as the osteon.  Jee (1983) denotes the trabecular packet as the basic structural unit of trabecular bone based on the fact that it is the basic remodeling unit of trabecular bone just as the osteon is the basic remodeling unit of cortical bone).  In rare circumstances it is possible to find unusually thick trabeculae containing a blood vessel and some osteon like structure with concentric lamellae.

Another structure found within the trabecula is the trabecular packet.  We have chosen to define the trabecular packet as a 1st level structure because of its size.  The trabecular packet is only found in secondary trabecular bone because it is the product of bone remodeling in which bone cells called osteoclasts first remove bone and bone cells called osteoblasts then deposit new bone were the old bone was removed.  Trabecular bone can only be remodeled from the outer surface of trabeculae.  The typical trabecular packet has a crescent shape (Jee, 1983).  A typical trabecular packet is about 50 mm thick and about 1 mm long.  Trabecular packets contain lamellae and are attached to adjacent bone by cement lines similar to osteons in cortical bone.

IV.2       Second Level Trabecular Bone Structure

The 2nd level structure of trabecular bone has most of the same entities as the 2nd level structure of cortical bone including lamellae, lacunae, canaliculi, and cement lines.  Trabecular bone, as noted before, does not generally contain vascular channels like cortical bone.  What differentiates trabecular bone from cortical bone structure is the arrangement and size of these entities.  For instance, although lamellae within trabecular bone structure are of approximately the same thickness as cortical bone (about 3 mm; Kragstrup et al., 1983), the arrangement of lamellae is different.  Lamellae are not arranged concentrically in trabecular bone as in cortical bone, but are rather arranged longitudinally along the trabeculae within trabecular packets (Fig. 5).  Krapstrup et al. noted that the thickness of lamellae tended to increase in age for females.  Cannoli et al. (1982) found a higher density and larger lacunae within metaphyseal and epiphyseal trabecular bone than in diaphyseal or metaphyseal cortical bone.  They found that the lacunae were ellipsoidal in both areas.  The cross-sectional area of lacunae in trabecular bone ranged between 50.6 and 53.8 mm2 while the cross-sectional area of lacunae in cortical bone ranged between 35 and 26 mm2.  Thus, the lamellar pattern as well as the lacunae size differ between trabecular and cortical bone.

IV.3       Third Level Trabecular Bone Structure

The third level of trabecular bone structure consists of the same entities as the third level of cortical bone structure, namely the collagen fibril-mineral composite.  As no detailed studies have been perfomed on trabecular bone at this level, it is presumed for now that the structure at this level, i.e collagen fibril organization within lamellae and collagen-mineral structure, is the same as for cortical bone.

An Analysis On Marfan Syndrome

I have only mentioned Marfan Syndrome in passing for a few old posts, like the one about Abraham Lincoln, but I wanted to focus on Marfan’s Syndrome at the more deep and detailed level here.

First, “What is Marfan Syndrome?”

From Wikipedia (HERE)… Again I will highlight the most important parts.

Marfan syndrome (also called Marfan’s syndrome) is a genetic disorder of the connective tissue. People with Marfan’s tend to be unusually tall, with long limbsand long, thin fingers.

The syndrome is inherited as a dominant trait, carried by the gene FBN1, which encodes the connective protein fibrillin-1. People have a pair of FBN1 genes. Because it is dominant, people who have inherited one affected FBN1 gene from either parent will have Marfan syndrome.

Marfan syndrome has a range of expressions, from mild to severe. The most serious complications are defects of the heart valves and aorta. It may also affect the lungs, the eyes, the dural sac surrounding the spinal cord, the skeleton and the hard palate.

In addition to being a connective protein that forms the structural support for tissues outside the cell, the normal fibrillin-1 protein binds to another protein,transforming growth factor beta (TGF-β). TGF-β has deleterious effects on vascular smooth muscle development and the integrity of the extracellular matrix. Researchers now believe, secondary to mutated fibrillin, excessive TGF-β at the lungs, heart valves, and aorta weakens the tissues and causes the features of Marfan syndrome. Since angiotensin II receptor antagonists (ARBs) also reduce TGF-β, ARBs (losartan, etc.) have been tested in a small sample of young, severely affected Marfan syndrome patients. In some patients, the growth of the aorta was indeed reduced.

Signs and symptoms

The constellation of long limbs, dislocated lenses and the aortic root dilation are generally sufficient to make the diagnosis of Marfan syndrome with reasonable confidence. More than 30 other clinical features are variably associated with the syndrome, most involving the skeleton, skin, and joints. Considerable clinical variability occurs within families carrying the identical mutation.

Skeletal system

Most of the readily visible signs are associated with the skeletal system. Many individuals with Marfan syndrome grow to above-average height. Some have long, slender limbs (dolichostenomelia) with long fingers and toes (arachnodactyly). An individual’s arms may be disproportionately long, with thin, weak wrists. In addition to affecting height and limb proportions, Marfan syndrome can produce other skeletal anomalies. Abnormal curvature of the spine (scoliosis), abnormal indentation (pectus excavatum) or protrusion (pectus carinatum) of the sternum are not uncommon. Other signs include abnormal joint flexibility, a high palate, malocclusions, flat feet, hammer toes, stooped shoulders, and unexplained stretch marks on the skin. It can also cause pain in the joints, bones and muscles in some patients. Some people with Marfan have speech disorders resulting from symptomatic high palates and small jaws. Early osteoarthritis may occur.

Pathogenesis

Marfan syndrome is caused by mutations in the FBN1 gene on chromosome 15, which encodes the glycoprotein fibrillin-1, a component of the extracellular matrix. Fibrillin-1 protein is essential for the proper formation of the extracellular matrix, including the biogenesis and maintenance of elastic fibers. The extracellular matrix is critical for both the structural integrity of connective tissue, but also serves as a reservoir for growth factors. Elastin fibers are found throughout the body, but are particularly abundant in the aorta, ligaments and the ciliary zonules of the eye; consequently, these areas are among the worst affected.

A transgenic mouse has been created carrying a single copy of a mutant fibrillin-1, a mutation similar to that found in the human gene known to cause Marfan syndrome. This mouse strain recapitulates many of the features of the human disease and promises to provide insights into the pathogenesis of the disease. Reducing the level of normal fibrillin 1 causes a Marfan-related disease in mice.

Transforming growth factor beta (TGFβ) plays an important role in Marfan syndrome. Fibrillin-1 directly binds a latent form of TGFβ, keeping it sequestered and unable to exert its biological activity. The simplest model of Marfan syndrome suggests reduced levels of fibrillin-1 allow TGFβ levels to rise due to inadequate sequestration. Although it is not proven how elevated TGFβ levels are responsible for the specific pathology seen with the disease, an inflammatory reaction releasing proteases that slowly degrade the elastin fibers and other components of the extracellular matrix is known to occur. The importance of the TGFβ pathway was confirmed with the discovery of the similar Loeys-Dietz syndrome involving the TGFβR2 gene on chromosome 3, a receptor protein of TGFβ. Marfan syndrome has often been confused with Loeys-Dietz syndrome, because of the considerable clinical overlap between the two pathologies.

Diagnosis

Diagnostic criteria of Marfan syndrome were agreed upon internationally in 1996. A diagnosis of Marfan syndrome is based on family history and a combination of major and minor indicators of the disorder, rare in the general population, that occur in one individual — for example: four skeletal signs with one or more signs in another body system such as ocular and cardiovascular in one individual. The following conditions may result from Marfan syndrome, but may also occur in people without any known underlying disorder.

Epidemiology

Marfan syndrome affects males and females equally, and the mutation shows no ethnic or geographical bias. Estimates indicate about one in 3,000 to 5,000 individuals have Marfan syndrome. Each parent with the condition has a 50% risk of passing the genetic defect on to any child due to its autosomal dominant nature. Most individuals with Marfan syndrome have another affected family member — approximately 15–30% of all cases are due to de novo genetic mutations—such spontaneous mutations occur in about one in 20,000 births. Marfan syndrome is also an example of dominant negative mutation and haploinsufficiency. It is associated with variable expressivity; incomplete penetrance has not been definitively documented.

Me: Since this site is about trying to figure out how to grow taller and increase height, we will only focus on the part of the disorder that causes people to be taller than average. We will look at what is the mechanism that causes the abnormally large height. Marfan Syndrome is caused from is inherited as a dominant trait, carried by the gene FBN1, which encodes the connective protein fibrillin-1. The trait is dominant so if a person gets even one copy of the allele, they will develop the syndrome. The normal fibrillin-1 protein binds to another protein,transforming growth factor beta (TGF-β). TGF-β has deleterious effects on vascular smooth muscle development and the integrity of the extracellular matrix. Angiotensin II receptor antagonists (ARBs) reduces TGF-β. Marfan syndrome is caused by mutations in the FBN1 gene on chromosome 15, which encodes the glycoprotein fibrillin-1, a component of the extracellular matrix. Fibrillin-1 protein is essential for the proper formation of the extracellular matrix, including the biogenesis and maintenance of elastic fibers. The extracellular matrix is critical for both the structural integrity of connective tissue, but also serves as a reservoir for growth factors. R

educing the level of normal fibrillin 1 causes a Marfan-related disease in mice. 

Transforming growth factor beta (TGFβ) plays an important role in Marfan syndrome. Fibrillin-1 directly binds a latent form of TGFβ, keeping it sequestered and unable to exert its biological activity. The simplest model of Marfan syndrome suggests reduced levels of fibrillin-1 allow TGFβ levels to rise due to inadequate sequestration.

So it seems that it is possible to make a person develop into a taller stature by putting a mutation in their FBN1 gene resulting in the decreased level of normal fibrillin 1, which leads to increased level of TGFbeta. The TGFbeta will partly ruin the connective tissue and the structural strength of the extracellular matrix which would allow the tissue including the bones to expand further than they are supposed to.

Endocrinology

One of the regular readers suggested adding a section for endocrinology so that people here can understand exactly the entire process on how human growth occurs and how height is determined.

The information that I have already provided is not very detailed on how exactly the hormones like estrogen, igf-1, hgh, the growth plates, and the pituitary gland are exactly connected to each other. One of the things I will do sometime within the next 4 months is to find a medical school textbook on endocrinology and explain the exact step-by-step process on how everything happens.

Note: All citations, references, links, sources, and used material will be labeled with a specific number i.e. Source 1 = (1)

Sources Used: Source 1, Source 2, Source 3, Source 4, Source 5, Source 6, Source 7, Source 8, Source 9, Source 10, Source 11, Source 12, Source 13


First, “What is Endocrinology?”

Medical Definition: Endocrinology is a branch of medicine that deals with the endocrine glands, actions of hormones and their metabolic consequences. (1)

There are two types (actually 3 but we won’t talk about the last one) of endocrinology going on today, scientific and clinical…

1. Scientific Endocrinology: It deals with the discovery and analysis of the structure and function of various hormones

2. Clinical Endocrinology: It deals with the clinical disorders of the endocrine system and the systems’s complex pathophysiology and management. (source)

Me: So we are basically going to look at the endocrine system, the organs associated with it, their functions, the hormones, and the pathways of the hormones that are related to growth and height.

For human growth, the endocrine glands that affect it are the…

  • Pituitary gland
  • Thyroid gland
  • Parathyroid gland
  • Testes and Ovaries (Sex or Reproductive organs)

1. Pituitary gland – secretes Growth Hormone (GH) aka Somatropin.

  • Somatropin (GH) – is the main regulator of height (2). Its functions include…
  •  – Stimulates bone and muscle growth
  •  – Maintains the normal rate of proteins synthesize in all the body cells
  •  – Speeds the release of fats as an energy source for growth
2. Parathyroid glands – releases the Parathyroid Hormone (PTH) when a low blood calcium is detected
  • Parathyroid Hormone (PTH) – stimulate the osteoclasts to break down the bone tissue so that calcium salts can be released into the blood
3. Thyroid gland – releases the hormone called Calcitonin in response to high levels of calcium in the blood
  • Calcitonin – seems to have the opposite effect as the Prathyroid Hormone (PTH)
  •  – it inhibits osteoclast activity allowing osteoblasts to form bone tissue. Thus, the excess calcium gets stored in the bone matrix