Monthly Archives: October 2012

Evidence That The LSJL Method Or Loading Is Ineffective In Post-Pubertal Adult Humans? (Important)

Me: I think this study that I somehow found seems to bring up evidence that the LSJL method that some height increase seekers have  been using might not be effective in generating the gains they have been hoping for. While the study never states at face value that there was at metaphysis lengthening form loading in prepubertal girls as compared to post pubertal girls, it seems to suggestively imply that.

The issue is that with the study, I couldn’t find where they said what actual type of loading was done. Did they use the same type of device as the stuff used on mice with Yokota and Zhang?

Analysis: The thing about this study was that length was never measured but only cortical diameter. As stated from the results section “Growth itself, as reflected by structural changes in the nonloaded arm, resulted in a 14% increase in cortical area of the mid- and distal humerus from the pre- to peripubertal years because of greater periosteal expansion than medullary expansion“. That could correlate to length increase assuming proportional size increase. For my final interpretation, I am of course assuming that the periosteal appositional growth we see in prepubertal females don’t just affect in the radial direction leading to bone thickening but also the limb ends of the epiphysis which leads to long bone lengthening too. For the post pubertal females the endocortical surface is what is begin affected, which means nothing to the outer surface of the bone which means neither lengthening to shortening.

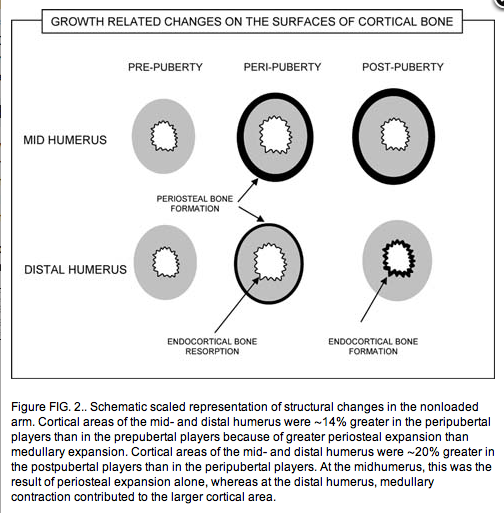
Main Points:Cortical areas of the mid- and distal humerus were ∼14% greater in the peripubertal players than in the prepubertal players because of greater periosteal expansion than medullary expansion. Cortical areas of the mid- and distal humerus were ∼20% greater in the postpubertal players than in the peripubertal players. At the midhumerus, this was the result of periosteal expansion alone, whereas at the distal humerus, medullary contraction contributed to the larger cortical area

Before puberty, periosteal apposition accounts for most of the increase in cortical area. Endocortical resorption creates an enlarging marrow cavity and partly offsets the increase in cortical area produced by periosteal apposition. The net result is an enlarged cortical area located further from the neutral axis, which has the effect of increasing its resistance to bending.(3) Late in puberty, periosteal apposition continues with a contribution from endocortical apposition(7); particularly at the distal humerus, where, in this study, the increase in cortical area was the result of equal contributions from periosteal and endocortical apposition.

Before puberty, loading magnified periosteal apposition. During the postpubertal period, loading magnified the effect of endocortical apposition, which makes an important contribution to cortical thickness in females. Indeed, endocortical apposition accounted for most of the greater side-to-side difference attained in the postpubertal years.

Thus, loading affects both the periosteal and the endocortical surfaces but the magnitude of the effects vary according to whether the surface is anterior, posterior, medial, or lateral and according to whether the region is proximal, central, or distal along the bone’s length. 

In conclusion, loading before puberty increases bone size and its resistance to bending. After puberty, loading increases the acquisition of bone on the endocortical surface with little benefit in the bone’s resistance to bending. Growth and the effects of loading were surface specific and varied along the length of the bone depending on the maturation of the region as well as the intensity and direction of loading. Increasing the bone’s resistance to bending and torsion is achieved by modifying the shape and mass of bone but not necessarily its density.

Conclusion: What might be the smartest thing to do is actually try to contact the people who originally did this experiment and try to ask them whether they ever tried to collect length data for the unloaded/loaded differences.

From PubMed Source link HERE

J Bone Miner Res. 2002 Dec;17(12):2274-80.

The effect of mechanical loading on the size and shape of bone in pre-, peri-, and postpubertal girls: a study in tennis players.

Bass SL, Saxon L, Daly RM, Turner CH, Robling AG, Seeman E, Stuckey S.

Source

School of Health Sciences, Deakin University, Melbourne, Australia.

Abstract

Exercise during growth results in biologically important increases in bone mineral content (BMC). The aim of this study was to determine whether the effects of loading were site specific and depended on the maturational stage of the region. BMC and humeral dimensions were determined using DXA and magnetic resonance imaging (MRI) of the loaded and nonloaded arms in 47 competitive female tennis players aged 8-17 years. Periosteal (external) cross-sectional area (CSA), cortical area, medullary area, and the polar second moments of area (I(P), mm4) were calculated at the mid and distal sites in the loaded and nonloaded arms. BMC and I(P) of the humerus were 11-14% greater in the loaded arm than in the nonloaded arm in prepubertal players and did not increase further in peri- or postpubertal players despite longer duration of loading (both, p < 0.01). The higher BMC was the result of a 7-11% greater cortical area in the prepubertal players due to greater periosteal than medullary expansion at the midhumerus and a greater periosteal expansion alone at the distal humerus. Loading late in puberty resulted in medullary contraction. Growth and the effects of loading are region and surface specific, with periosteal apposition before puberty accounting for the increase in the bone’s resistance to torsion and endocortical contraction contributing late in puberty conferring little increase in resistance to torsion. Increasing the bone’s resistance to torsion is achieved by modifying bone shape and mass, not necessarily bone density.

PMID: 12469922    [PubMed – indexed for MEDLINE] 

This source link HERE is the full article.

Keywords:

  • exercise; growth and development; bone strength; rigidity

Abstract

Exercise during growth results in biologically important increases in bone mineral content (BMC). The aim of this study was to determine whether the effects of loading were site specific and depended on the maturational stage of the region. BMC and humeral dimensions were determined using DXA and magnetic resonance imaging (MRI) of the loaded and nonloaded arms in 47 competitive female tennis players aged 8–17 years. Periosteal (external) cross-sectional area (CSA), cortical area, medullary area, and the polar second moments of area (IP, mm4) were calculated at the mid and distal sites in the loaded and nonloaded arms. BMC and IP of the humerus were 11–14% greater in the loaded arm than in the nonloaded arm in prepubertal players and did not increase further in peri- or postpubertal players despite longer duration of loading (both, p < 0.01). The higher BMC was the result of a 7–11% greater cortical area in the prepubertal players due to greater periosteal than medullary expansion at the midhumerus and a greater periosteal expansion alone at the distal humerus. Loading late in puberty resulted in medullary contraction. Growth and the effects of loading are region and surface specific, with periosteal apposition before puberty accounting for the increase in the bone’s resistance to torsion and endocortical contraction contributing late in puberty conferring little increase in resistance to torsion. Increasing the bone’s resistance to torsion is achieved by modifying bone shape and mass, not necessarily bone density.

INTRODUCTION

Exercise during growth results in biologically important increases in bone mass. Growth in bone width and cortical thickness before puberty occurs by greater periosteal (outer surface) apposition than by endocortical (inner surface) resorption. During puberty, estrogen production inhibits periosteal apposition but stimulates the acquisition of bone on the endocortical surface.(1)

It has been proposed that exercise will enhance formation at the surfaces of bone undergoing bone apposition.(2) Because apposition of bone on the periosteal surface is a more effective means of increasing the bending and torsional strength of bone than acquisition of bone on the inner surface,(3) exercise regimens may be more effective when undertaken at a time when the growth of bone is dominated by periosteal rather than endocortical growth.

Exercise has been reported to enhance periosteal expansion in young animals and endocortical contraction in mature animals. Thus, to determine whether the effects of exercise depend on the maturational stage of the region exposed to loading as well as the intensity and duration of the loading, we tested the following hypotheses: (i) loading of bone during tennis playing will result in increased cortical area of the playing humerus because of periosteal expansion with no endocortical apposition in the pre- and peripubertal years; (ii) during the postpubertal years, loading will increase cortical area by endocortical apposition with less contribution from periosteal apposition; and (iii) the exercise-induced increase in cortical area and bending strength of the humerus will be caused by greater periosteal apposition with little or no contribution from endocortical bone acquisition.

MATERIALS AND METHODS

Subjects

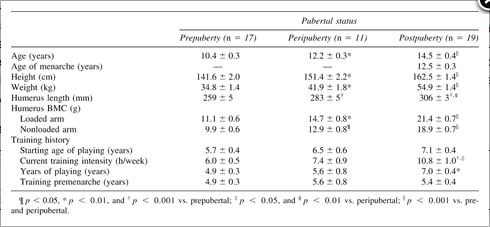
Forty-seven pre-, peri-, and postpubertal competitive female tennis players aged 8–17 years were recruited from tennis clubs in Melbourne, Australia. Players were included if they had been playing competitive tennis for a minimum of 2 years and were currently playing at least 3 h/week (Table 1). Forty girls were right-handed, and 41 girls used a double-handed backhand. Longitudinal data were collected in 37 subjects after 1.1 ± 0.01 years (range, 0.8–1.5 years); 6 subjects remained prepubertal, 6 subjects became peripubertal, 9 subjects remained peripubertal, and 16 subjects remained postpubertal during the observation period. Ten subjects were not included because they were either no longer playing (n = 2), not willing to participate (n = 4), or relocated (n = 4).

Table Table 1.. Age, Age of Menarche, and Training History of Pre-, Peri-, and Postpubertal Female Tennis Players (Mean ± SEM)

All girls were healthy and received no medication known to affect the skeleton. The Deakin University and Alfred Hospital ethics committees approved the study, and written consent was obtained from all participants and their parents. Sexual maturation was self-assessed with parental guidance using the standard five-scale Tanner stages for breast development. Subjects were classified as prepubertal (Tanner stage 1), peripubertal (Tanner stage 2–4), or postpubertal (postmenarche).


Bone geometry, mass, and strength

Magnetic resonance imaging (MRI) was used to determine bone dimensions (1.5 T whole-body unit; with a commercial transit-receive torso coil; Signa Advantage GE Medical Systems, Milwaukee, WI, USA). T1-weighted spin-echo images at a repetition time (TR) of 600 ms and an echo time (TE) of 14 ms were acquired in the axial plane. Field of view was 200 mm2 and the matrix size was 512 × 192. The region of interest (ROI) was 30–60% from the distal end of the humerus and was divided into thirds. Areas of the proximal third of the ROI representing the midportion of the humerus were compared with the distal third. Five-millimeter slices (with 5-mm gaps between slices) were scanned along the ROI. Each axial image was analyzed using the OSIRIS imaging software program (Digital Imaging Unit, Center of Medical Informatics, University Hospital of Geneva, Geneva, Switzerland). Periosteal area was the external size of the bone (i.e., periosteal border) and cortical area was periosteal minus the medullary area (Fig. 1).

thumbnail image

Figure FIG. 1.. Typical MRI transverse slices of cortical bone (black) and medullary area (white) of the playing and nonplaying humerus of a postpubertal female tennis player. ROIs were analyzed at the mid- and distal humerus, each representing 10% of the total arm length (30–40% and 50–60%, measured from the distal condyles).

Summing the cross-sectional areas of each slice in the ROI divided by the total number of slices in the ROI determined average periosteal, cortical, and medullary areas. The short-term precision (CV) was 1.02% and 0.21% for periosteal and cortical bone areas, respectively. In vivo studies using bovine bones have shown that MRI provides accurate estimates of bone cross-sectional areas, and these data correlate well with quantitative computed tomography (QCT) measurements of the same bone (r2 = 0.98).(4) Bone mineral content (BMC) of the playing and nonplaying arm was measured using DXA (CV for BMC was 3.6%; Lunar DPX-L, version 1.3b; Lunar Corp., Madison, WI, USA).

To assess the bones resistance to bending (rigidity), each image was imported into Scion Image 4.0.2 (Scion Corp., Frederick, MD, USA). The maximum (IMAX, mm4) minimum (IMIN, mm4), and polar (IP, mm4) second moments of area were calculated using a custom macro. The second moment of area (I) reflects a structure’s resistance to bending and is calculated by dividing the section into small areas (pixels), and multiplying each (dA) by its squared distance from the neutral plane. This procedure is integrated over the entire cross-section. The macro calculates I about all possible neutral planes and reports the largest value as IMAX and the smallest value as IMIN, which are perpendicular to one another. The polar second moment of area (IP) reflects a long bones resistance to torsion and equals the sum of the maximum and minimum moments of area (IP = IMAX + IMIN).

Statistical analysis

Data were expressed in absolute terms and as a percentage of the nonplaying arm. Within each pubertal group, side-to-side differences were assessed using paired t-tests. ANOVA, with Tukey post hoc comparisons, was used to detect differences between pubertal groups. In the longitudinal analysis, subjects were divided according to pubertal status: prepuberty to prepuberty (n = 16), peripuberty to peripuberty (n = 15, includes prepuberty to peripuberty and peripuberty to peripuberty), and postpuberty to postpuberty (n = 16). Repeated measures ANOVA and analysis of covariance (ANCOVA) were used to determine changes over time in bone strength adjusted for bone size. Significance is reported as p < 0.05; borderline significances are reported at p < 0.1. All data are reported as mean ± SE unless otherwise stated.

RESULTS

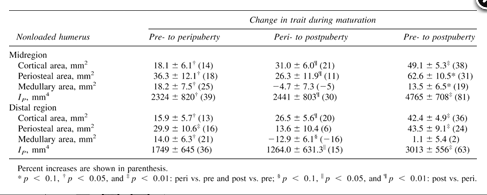
Growth itself, as reflected by structural changes in the nonloaded arm, resulted in a 14% increase in cortical area of the mid- and distal humerus from the pre- to peripubertal years because of greater periosteal expansion than medullary expansion (Table 2 and Fig. 2). Cortical area of the mid- and distal humerus were both ∼20% greater in the postpubertal players than in the peripubertal players (Table 2and Fig. 2). At the midhumerus, this was the result of periosteal expansion alone, whereas at the distal humerus, medullary contraction contributed to the larger cortical area.

Table Table 2.. Cross-Sectional Analyses of the Change in Cortical, Periosteal, and Medullary Bone Areas and the Second Polar Moment of Area (Ip) in the Nonloaded Humerus With Advancing Maturation (Mean ± SEM)


Figure FIG. 2.. Schematic scaled representation of structural changes in the nonloaded arm. Cortical areas of the mid- and distal humerus were ∼14% greater in the peripubertal players than in the prepubertal players because of greater periosteal expansion than medullary expansion. Cortical areas of the mid- and distal humerus were ∼20% greater in the postpubertal players than in the peripubertal players. At the midhumerus, this was the result of periosteal expansion alone, whereas at the distal humerus, medullary contraction contributed to the larger cortical area.

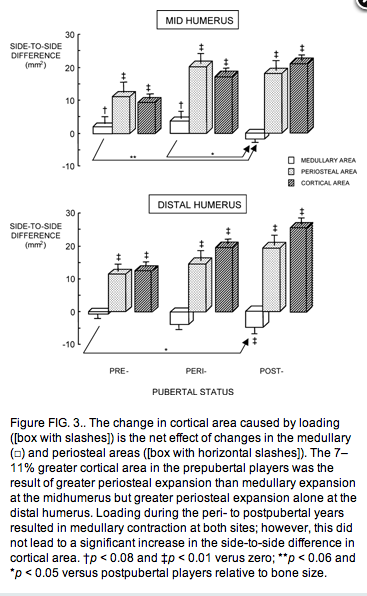
The effect of loading was reflected in the side-to-side trait differences. BMC and resistance to torsion (IP) of the humerus were 11–14% greater in the loaded arm than in the nonloaded arm in the prepubertal players (both p < 0.01) and did not increase further in peri- or postpubertal players despite longer duration of loading (Tables 1 and 3). The higher BMC was the result of a 7–11% greater cortical area in the prepubertal players, which was the result of greater periosteal expansion than medullary expansion at the midhumerus but greater periosteal expansion alone at the distal humerus (Table 3 and Fig. 3). Loading during the peri- to postpubertal years resulted in medullary contraction at both sites; however, this did not lead to a significant increase in the side-to-side difference in cortical area (Table 3 and Fig.3).

Table Table 3.. Average Bone Areas of the Mid- and Distal Regions of the Humeral Shaft in the Loaded and Nonloaded Humerus of Pre-, Peri-, and Postpubertal Female Tennis Players (Mean ± SEM)


Figure FIG. 3.. The change in cortical area caused by loading ([box with slashes]) is the net effect of changes in the medullary (□) and periosteal areas ([box with horizontal slashes]). The 7–11% greater cortical area in the prepubertal players was the result of greater periosteal expansion than medullary expansion at the midhumerus but greater periosteal expansion alone at the distal humerus. Loading during the peri- to postpubertal years resulted in medullary contraction at both sites; however, this did not lead to a significant increase in the side-to-side difference in cortical area. †p < 0.08 and ‡p < 0.01 verus zero; **p < 0.06 and *p < 0.05 versus postpubertal players relative to bone size.

Similar observations were made in the 37 girls followed during the 12 months of follow-up. In particular, cortical area at the distal site increased 4% more in the loaded arm than in the nonloaded arm in the postpubertal players because of contraction of medullary area (2%,p < 0.05) and increased periosteal expansion (2%, NS).

DISCUSSION

Growth in the external size of a long bone, its cortical thickness, and the distribution of cortical bone about the neutral axis are determined by the absolute and relative behavior of the periosteal and endocortical bone surfaces along the length of the bone.(5, 6) Before puberty, periosteal apposition accounts for most of the increase in cortical area. Endocortical resorption creates an enlarging marrow cavity and partly offsets the increase in cortical area produced by periosteal apposition. The net result is an enlarged cortical area located further from the neutral axis, which has the effect of increasing its resistance to bending.(3) Late in puberty, periosteal apposition continues with a contribution from endocortical apposition(7); particularly at the distal humerus, where, in this study, the increase in cortical area was the result of equal contributions from periosteal and endocortical apposition.

In addition to surface specificity, growth is also region specific with more rapid maturation of distal regions than proximal regions. Distal segments of the appendicular skeleton mature before the proximal segments.(1,7,8) The longitudinal data indicate that when the subjects were older, endocortical contraction was detected at the midhumerus but not at the distal humerus.

Loading magnifies the structural changes produced during growth and this was detected by comparing the trait differences in the loaded and nonloaded arms. The data suggest that during growth the effect of exercise, like the effect of risk factors, is determined not only by the intensity of exercise or severity of illness, but also by the timing of exposure.(7, 9) Before puberty, loading magnified periosteal apposition. During the postpubertal period, loading magnified the effect of endocortical apposition, which makes an important contribution to cortical thickness in females. Indeed, endocortical apposition accounted for most of the greater side-to-side difference attained in the postpubertal years.

Most of the structural changes occurred early in the prepubertal years because adaptive changes in response to loading were sufficient to reduce the strains in bone that may lead to microdamage if not decreased.(10, 11) The only additional benefit achieved from tennis training later in puberty was contraction of the medullary cavity, which did not confer any additional increase in the structural rigidity of the bone. Similar effects have been reported in soccer players in whom increased duration of training beyond 6 h/week had no benefit on bone mass.(12) To further modify bone mass or architecture, other components of loading other than duration (i.e., magnitude or strain patterns) would have to increase, as reported in elite gymnasts.(13)

Heterogeneity in the response to loading has been reported in several studies.(14–17) The relative contributions of periosteal and endocortical modeling and remodeling varies along the whole length of a limb.(18) Local loading will modify each part of the geometry of the bone in accordance with the imposed load. In racquet sports, the greater humeral cortical area of the loaded versus the nonloaded arm is the result of both greater periosteal expansion and greater endocortical contraction; for instance, the relative contributions of periosteal expansion and endocortical contraction to the greater cortical thickness in the loaded arm than in the nonloaded arm in a study by Haapasalo et al. were 75:25 at the proximal humerus and 10:90 at both mid- and distal humerus.(15) In the study by Jones et al., the respective relative contributions of greater periosteal expansion and greater endosteal contraction to the greater cortical thickness were 60:40 in the anteroposterior dimension and 80:20 in the mediolateral dimension in male and female tennis players.(16)

Thus, loading affects both the periosteal and the endocortical surfaces but the magnitude of the effects vary according to whether the surface is anterior, posterior, medial, or lateral and according to whether the region is proximal, central, or distal along the bone’s length. Measurements of bone geometry in two dimensions using densitometry or X-rays cannot adequately describe this heterogeneity. Bone is not a cylinder with a circular perimeter and the assumption that loading will produce homogenous changes is flawed.

In conclusion, loading before puberty increases bone size and its resistance to bending. After puberty, loading increases the acquisition of bone on the endocortical surface with little benefit in the bone’s resistance to bending. Growth and the effects of loading were surface specific and varied along the length of the bone depending on the maturation of the region as well as the intensity and direction of loading. Increasing the bone’s resistance to bending and torsion is achieved by modifying the shape and mass of bone but not necessarily its density.

Acknowledgements

The authors thank radiographers Amanda Hunt and Glenn Rush for their technical assistance. They also thank the players and their parents for their time given to this study. This study was funded by grants from the Australian Research Council Grant and the School of Health Sciences, Deakin University.

REFERENCES

  • 1. Garn S 1970 The Earlier Gain and Later Loss of Cortical Bone. Charles C Thomas, Springfield, IL, USA.
  • 2. Ruff CB, Walker A, Trinkaus E 1994 Postcranial Robusticity in Homo. III: Ontogeny. Am J Phys Anthrop 93: 35–54.
  • 3. Turner CH, Burr DB 1993 Basic biomechanical measurements of bone: A tutorial. Bone 14: 595–608.
  • 4. Woodhead HJ, Kemp AF, Blimkie CJR, Briddy JN, Duncan CS, Thompson M, Lam A, Howman-Giles R, Cowell CT 2001Measurement of midfemoral shaft geometry: Repeatability and accuracy using magnetic resonance imaging and dual-energy X-ray absorptiometry. J Bone Miner Res 16: 2251–2259.
  • 5. Seeman E 2002 An exercise in geometry. J Bone Miner Res 17: 373–380.
  • 6. Seeman E 2001 Clinical review 137: Sexual dimorphism in skeletal size, density, and strength. J Clin Endocrinol Metab 86:4576–4584.
  • 7. Bass S, Delmas PD, Pearce G, Hendrich E, Tabensky A, Seeman E 1999 The differing tempo of growth in bone size, mass and density in girls is region-specific. J Clin Invest 104: 795–804.
  • 8. Preece MA, Hendrich I 1981 Mathematical modelling of individual growth curves. Br Med Bull 37: 247–252.
  • 9. Seeman E, Karlsson M, Duan Y 2000 On exposure to anorexia nervosa, the temporal variation in axial and appendicular skeletal development predisposes to site-specific deficits in bone size and density: A cross-sectional study. J Bone Miner Res 15:2259–2265.
  • 10. Frost H 1987 The mechanostat: A proposed pathogenic mechanism of osteoporosis and the bone mass effects of mechanical and nonmechanical agents. Bone Miner 2: 73–86.
  • 11. Lanyon LE 1987 Functional strain in bone tissue as an objective and controlling stimulus for adaptive remodelling. J Biomech 20:1083–1093.
  • 12. Karlsson MK, Magnusson H, Karlsson C, Seeman E 2001 The duration of exercise as a regulator of bone mass. Bone 28:128–132.
  • 13. Bass S, Pearce G, Bradney M, Hendrick E, Delmas P, Harding A, Seeman E 1998 Exercise before puberty may confer residual benefits in bone density in adulthood: Studies in active prepubertal and retired female gymnasts. J Bone Miner Res 13: 500–507.
  • 14. Haapasalo H, Sievanen H, Kannus P, Heinonen A, Oja P, Vuori I 1996 Dimensions and estimated mechanical characteristics of the humerus after long-term tennis loading. J Bone Miner Res 11: 864–872.
  • 15. Haapasalo H, Kontulainen S, Sievanen H, Kannus P, Jarvinen M, Vuori I 2000 Exercise-induced bone gain is due to enlargement in bone size without a change in volumetric bone density: A peripheral quantitative computed tomography study of the upper arms of male tennis players. Bone 27: 351–357.
  • 16. Jones HH, Priest JD, Hayes WC, Tichenor CC, Nagel DA 1977 Humeral hypertrophy in response to exercise. J Bone Joint Surg Am 59A: 204–208.
  • 17. Huddleston A, Rockwell D, Kulund DN, Harrison B 1980 Bone mass in lifetime tennis athletes. JAMA 244: 1107–1109.
  • 18. Hsieh YF, Robling AG, Ambrosius WT, Burr DB, Turner CH 2001 Mechanical loading of diaphyseal bone in vivo: The strain threshold for an osteogenic response varies with location. J Bone Miner Res 16: 2291–2297.

From an old link on P. Zhangs’s article on joint loading on hindlegs of pre-pubescent mice HERE…. For the Full Text of the study click HERE.

J Bone Miner Metab. 2010 May;28(3):268-75. Epub 2009 Nov 5.

Lengthening of mouse hindlimbs with joint loading.

Zhang P, Hamamura K, Turner CH, Yokota H.

Source

Department of Biomedical Engineering, Indiana University-Purdue University Indianapolis, Indianapolis, IN 46202, USA.

Abstract

For devising clinical approaches to treating limb length discrepancies, strategies that will generate differential longitudinal growth need to be improved. This report addresses the following question: does knee loading increase bone length of the loaded hindlimb? Knee loading has been shown to induce anabolic responses on the periosteal and endosteal surfaces, but its effects on longitudinal bone growth have not yet been examined. In the present studies, loads were applied to the left hindlimb (5-min bouts at 0.5 N) of C57/BL/6 mice (21 mice, ~8 weeks old). Compared to the contralateral and age-matched control groups, knee loading increased the length of the femur by 2.3 and 3.5%, together with the tibia by 2.3 and 3.7% (all P < 0.001), respectively. In accordance with the length measurements, knee loading elevated BMD and BMC in both the femur and the tibia. Histological analysis of the proximal tibia revealed that the loaded growth plate elevated its height by 19.5% (P < 0.001) and the cross-sectional area by 30.7% (P < 0.05). Particularly in the hypertrophic zone, knee loading increased the number of chondrocytes (P < 0.01) as well as their cellular height (P < 0.001) along the length of the tibia. Taken together, this study demonstrates for the first time the potential effectiveness of knee loading in adjusting limb length discrepancy.

PMID: 19890688       [PubMed – indexed for MEDLINE]

How To Build A Personal LSJL Automatic Device For Less Than $600

One of Tyler’s comments which was posted to me got me wondering whether there might be a easier way to possibly do the Lateral Synovial Joint Loading. The clamps we might buy operates on a rather easily understood principle. Two blunt, rather flat surfaces is compressive down upon bone tissue to try to create bone modification. Most people have legs that are about 3-4 inches in diameter and the knee is often slightly smaller in width.

[The exact location we are supposed to load the clamp is the protruding bumps on the side of our limb synovial joints. There are 5 locations that I can think of from the top of my head, the wrist area, the elbow area of the forearm, above the knee where the distal femur epiphysis is, below the knee where the proximal tibia and fibula are, and the ankle area where the tibia is connected to the feet bones.]

This means that any device that is build must be able to at least clamp around 4 inches of material. We know that we can try using weights/ dumbbell but that is hard to aim and really compress/load in the right area. Plus, the other side using a dumbbell would have the hard floor to load on.

What I propose in this post is to build an automatic LSJL device for less than $600 in cost, using material one can find from EBay and speciality shops on the internet.

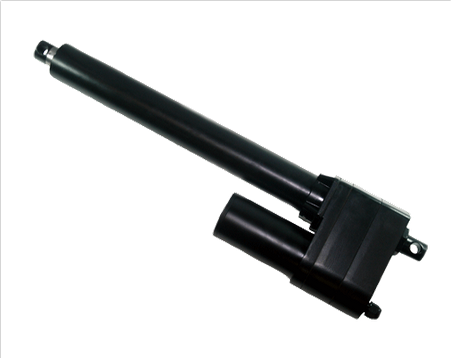
When I first started on the idea, I envisioned in my head a device that was similar to a piston that push in a axial direction with sinusoidal behavior. When I called and around and did some research, most people at a hardware store or electronic store could not even give a name what such a device would look like.

I have worked in building robots before so I know that if the device could not be bought as an intact device, then it could be built, because I know exactly which parts are needed. Eventually I found the right suppliers and parts to make the device.

These are the parts needed

1. We need to buy two linear actuators. The two types I would suggest is get either the electro-mechanical or the linear motor, which can give one some speed. The actuators are what would allow one to control the stroke action, where one stroke compresses and load, while the alternate stroke releases the loading. A website to use is Progressive Automations. For the actual thing to buy, we would be looking for the strongest ones since I am almost positive to scale up the loading from the original experiments done on mice hindleg bone, we might have to multiple the loading force by at least 10,000X.

Note three factors of the actuators,

  • 1. stroke size – this is the maximum stroke or actual length that can happen. This also determines the both the size of the actual device and the range one can put the actuators apart from each other.
  • 2. force – the amount of loading that is being exerted.
  • 3. speed – the amount of change that the stroke can change by per second.
We have to remember the actual values of the loading (in Newtons) , the frequency, and the frequency each week the loading was done on the mice legs and keep the frequency the same, but increase the loading amount. I personally would suggest trying at a force of around 100X to start with.
I do note that most of the stuff on the Progressive Automations website are either fast and light or slow and strong. Go with the actuators that only have a stroke size of 4″ or less since you want to make this device at least small enough and portable to move it rather easily. I would go with the Tubular High Speed models first which can go up to 9-3″/sec but relatively weak at 33-11 lb at $160 each. If the loading is not strong enough, move on towards the heavy duty ones with 2000 lb force, 2 or 4 ” stroke size, and 0.24″/sec speed. These cost about $300 each.

2. We need to buy a field-programmable gate array (FPGA). FPGAs are integrated circuits which you can plug to your own computer and program to send specific signals out. For more information on FPGA check out the wikipedia article on it HERE. For a company where you can buy a very nice easy to use FPGA board you can try Digilent Inc HERE. You can get a Nexys-3 Spartan-6 for $200 but also discount it for $120 if you are a student. This should handle simultaenous devices. Remember that if you are using the board to control the stroking movement, you have to get the digital actuators which I haven’t looked into.

3. You need a board and a mounting bracket sold HERE to hold the electro-mechanical actuators in place, at about 6 inches apart from each other in their standard resting distance. depending on what size of stroke you buy, you may have to put the devices either further apart or closer together to account for both the stroke size and your leg width.

4. You need a computer with knowledge on embedded systems to program the FPGA board. This part I have no knowledge on. It would take me at least 3 months to learn how to program using the original language I used which was Assembly. Most people seem to suggest using C or Java these days. Almost any Electrical Engineering major in university would know how to do this part.

5. It might be helpful if on the ends you put some types of plastic plug or covering to avoid skin chafing or stretching when the loading is happening.

Alternatively, if you don’t want to get the stuff for 2 and 4, you can get the control box for the actuators HERE. There is a nice video on the website to show how easy it is to just use the control box. You want to buy the one AC controller with 2 motors with simultaneous function which costs $186. However, the issue is that they seem to only have one speed, but we would need to test the leg bone’s response to different frequencies and speeds. That is why we can modulate the speed of the actuator with the FPGA board.

Actual construction: So you basically just mount the two linear actuators facing each other, screw or bolt the devices on a board or plane which will not be moving, plug the actuator cord into the board, and program the board to send specific wave function signals to the actuator to either stoke in or out. The simpler method would be to remove the Board completely and just go with a controller board but one might have to replace and switch actuators if the speed and force are not right for the bone lengthening effect we desire. No matter what, you need at least 4 parts, the two actuators, something to control it, and the mounting parts to hold the actuators down to a flat solid surface. The combined total is around the $600 range for the weaker loading devices and around $800 for the stronger loading devices.


A Final Message On The InstaHEIGHT Products And Any Other Height Increase E-Products Out There, For You Rafael

Note: This is a message for Rafael and any other future and new readers who come to this website asking about E-Products found on the internet dealing with Height Increase.

I was planning on not writing any new posts for at least 7 days while I change a few things on the website but this new recent development has to be resolved.

In my last post I had done a product review on the E-Books from the InstaHEIGHT.com website since a regular reader of the website Rafael informed me and another regular reader that there was another E-Book for Height Increase out there. I looked at the website, read the links and citations, and had concluded that the book is part of a scam.

Maybe I was not clear on what I mean. What I meant to say is that the E-product will not work for a person who is already a physically mature adult, with no growth plates available. If you are still young and can still grow, the advice might help. If your bones are set, I would suggest trying something else.

I have looked through the 2 main products, the E-Book “HGH Explained, Understanding InstaHEIGHT Super Massing” and the E-Book “Inch Adding, Get Taller Today” both by authors Deavon Stollar & Harry Pope.

A Slightly Deeper Analysis: First of all, the 1st PDF/Book is only 41 pages of actual PDF writing with 4 of those pages with pictures of only ads. The other book/PDF is 21 pages with 5 of the pages having no information. All the information in the E Books I can reproduce at a higher level of detail. Of course I have been researching and studying this stuff for a few months though. On the first Doc there is suppose to be a chapter #7 which is entitled ” The instaHeight super massing procedure ” and that on pg. 34 is completely missing. Why is that entire chapter missing?  There is also no actual steps or actions the Book tells me to actually take in the entire PDF. I could not find any steps on what I should be actually doing. The chapter that is supposed to be of actual use and action is missing. 

All the 3 E-Book PDFs  you have given me I have already uploaded to the “Downloads” section of the website. I want to show and give it to the other people in the world who wish to look at it, analyze it, and see if it is real or not. If you are upset at me over this since they did not have to pay that type of money, then I will pay you the money back for it. Just contact me on the website email, sent me your Bank account Real Name, routing #, account #, and which bank you use (need bank transit #) and I will transfer you the $67 you paid through my Bank Of America checking account if you should desire. All that I ask is that you come along this website and write a message which will be posted saying that I have given you my own money to help you out so that at least you won’t be hurt financially by this.

[Note: Since you are the first reader of this website to be so adamant and believe in an E-Product that I have not seen before, I will only do this ONE time and never again. I will be giving you my own money just to cover you if you so should wish but this will not happen again for anyone else after this event.]

If you happened to be a internet marketer who is selling the InstaHEIGHT product and trying to trick me by coming to this website to promote the product then I can only say that I am sorry about that. We all have to make our own decisions on how we choose to live our lives. Rafael, I am going to ask that you try to use the Refund policy on the InstaHEIGHT website and get your money back.   The internet is full of huckster and sometimes we get tricked. I have been tricked myself when I didn’t know better.

I have not revealed who I am at this time yet but I think it is time that I at least reveal my first name to the readers of this website/blog to  make myself more transparent. I am really hear to inform, help others, and do research for this endeavor.

My name is Michael. I am 28 years old. And I want to help myself and others possibly get taller and gain extra height. Honestly, legitimately, with real scientific evidence and facts. 

The Mitogen-Activated Protein Kinase, MAPK And Extracellular-Signal-Regulated Kinases, ERK pathway

Note: A lot of the material and information that I will be posting on this post will also be found on the “Protein/Hormone Signal Pathway Map” Post and also the “Molecular Biology, Biochemistry” section of the website

Note: As like the PI3K/AKT pathway, there is a video you can watch to help make the learning process a little easier from YouTube HERE.

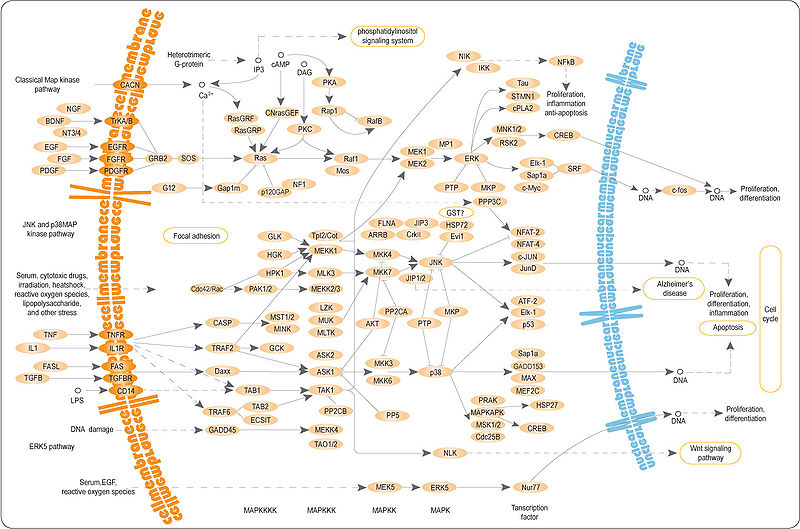
From the wikipedia article on MAPK/ERK pathway HERE.. a simplified version of the MAPK pathway is available below.

The MAPK/ERK pathway is a chain of proteins in the cell that communicates a signal from a receptor on the surface of the cell to the DNA in the nucleus of the cell. The signal starts when a signaling molecule binds to the receptor on the cell surface and ends when the DNA in the nucleus expresses a protein and produces some change in the cell, such as cell division. The pathway includes many proteins, including MAPK (originally called ERK), which communicate by adding phosphate groups to a neighboring protein, which acts as an “on” or “off” switch. When one of the proteins in the pathway is mutated, it can be stuck in the “on” or “off” position, which is a necessary step in the development of many cancers. Components of the MAPK/ERK pathway were discovered when they were found in cancer cells. Drugs that reverse the “on” or “off” switch are being investigated as cancer treatments.

The pathway

Overall, the extra-cellular mitogen binds to the membrane ligand. This allows Ras (a GTPase) to swap its GDP for a GTP. It can now activate MAP3K (e.g., Raf), which activates MAP2K, which activates MAPK. MAPK can now activate a transcription factor, such as myc.

Coupling cell surface receptors to G proteins

Receptor-linked tyrosine kinases such as the epidermal growth factor receptor (EGFR) are activated by extracellular ligands. Binding of epidermal growth factor (EGF) to the EGFR activates the tyrosine kinase activity of the cytoplasmic domain of the receptor. The EGFR becomes phosphorylated on tyrosine residues. Docking proteins such as GRB2 contains an SH2 domain that binds to the phosphotyrosine residues of the activated receptor. GRB2 binds to the guanine nucleotide exchange factor SOS by way of the two SH3 domains of GRB2. When the GRB2-SOS complex docks to phosphorylated EGFR, SOS becomes activated. Activated SOS then promotes the removal of GDP from a member of the Ras subfamily (most notably H-Ras or K-Ras). Ras can then bind GTP and become active.

Apart from EGFR, other cell surface receptors that can activate this pathway via GRB2 include Trk A/B, Fibroblast growth factor receptor (FGFR) and PDGFR.

Kinase cascade

Activated Ras activates the protein kinase activity of RAF kinase. RAF kinase phosphorylates and activates MEK (MEK1 and MEK2). MEK phosphorylates and activates a mitogen-activated protein kinase (MAPK).

RAF, and MAPK are both serine/threonine-selective protein kinases. MEK (also known as MAPKK) is a tyrosine/threonine kinase.

In the technical sense, RAF, MEK, and MAPK are all mitogen-activated kinases, as is MNK. MAPK was originally called “extracellular signal-regulated kinases” (ERKs) and “microtubule-associated protein kinase” (MAPK). One of the first proteins known to be phosphorylated by ERK was a microtubule-associated protein (MAP). As discussed below, many additional targets for phosphorylation by MAPK were later found, and the protein was renamed “mitogen-activated protein kinase” (MAPK). The series of kinases from RAF to MEK to MAPK is an example of a protein kinase cascade. Such series of kinases provide opportunities forfeedback regulation and signal amplification.

Regulation of translation and transcription

Three of the many proteins that are phosphorylated by MAPK are shown in the Figure. One effect of MAPK activation is to alter the translation of mRNA to proteins. MAPK phosphorylates 40S ribosomal protein S6 kinase (RSK). This activates RSK, which, in turn, phosphorylates ribosomal protein S6.[5] Mitogen-activated protein kinases that phosphorylate ribosomal protein S6 were the first to be isolated.[4]

MAPK regulates the activities of several transcription factors. MAPK can phosphorylate C-myc. MAPK phosphorylates and activates MNK, which, in turn, phosphorylates CREB. MAPK also regulates the transcription of the C-Fos gene. By altering the levels and activities of transcription factors, MAPK leads to altered transcription of genes that are important for the cell cycle.

The 22q11, 1q42, and 19p13 genes are associated with schizophrenia, schizoaffective, bipolar, and migraines by affecting the ERK pathway.


From wikipedia link on MAPK/ERK Pathway HERE, I will post a picture of the pathway below for analysis

Analysis & Interpretation:

This pathway has an overall similar structure and area of function as the Wnt/Beta-Catenin Signal Pathway as we have seen before. It is a protein chain or cascade signal pathway where the chain of protein interactions start off at the outer surface of the cell, in the plasma membrane. The outer receptors on the bi-lipid layer gets attached to what is known as a signal molecule. The end result is that the DNA is affected in a certain way from a multiple of cascading signalling pathways to produce or cause a certain type of protein to be either increased or decreased in number, which will affect the overall cell.

The effect on the cell can be just as that it will be told by the proteins produced to focus mainly on differentiation, replication, division, proliferation, apoptosis, etc.

The reason the pathway is called the MAPK/ERK pathways is because one of the more major components in this cascade or chain is the MAPK which used to be called the ERK. The MAPK stands for Mitogen-Activated Protein Kinase and the ERK stands for Extracellular-Signal-Regulated Kinases. Like most other protein kinases, their job is to add on a phosphate group to some protein that is close by to it in the intracellular matrix to turn it either “on” or “off”.

Overall there is one major overall pathway or cascades going on, with many smaller more individual pathways all happening.

1. Extracellular mitogen binds to the membrane ligand –> Something called a RAS changes the GDP its has for a GTP –> This actives the a type of protein kinase group called MAP3K (one of the proteins in the MAP3K group is RAF) to signal and activate the kinase group MAP2K which signals and activates the kinase group MAPK. The protein kinase group MAPK ultimate can effect transcription factors like MYC (have no idea what that is right now).

  • The membrane ligand or membrane receptor can be like a epidermal growth factor receptor (EGFR). These receptors are linked beforehand to another kinase.
  • The extracellular mitogen can be like a epidermal growth factor (EGF). Another name for the extrecellular mitogen is the extracellular ligands

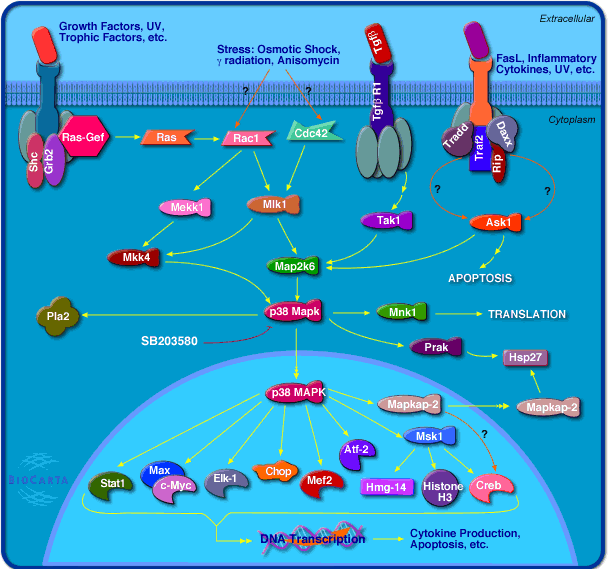
The result is that there will be some types of residues formed from the activation of the receptor linked to the kinase. Different types of proteins which then dock on the kinase will get phosphorylated and this will in effect activate other proteins around it. From the diagram below we can see that at some stage of the multiple cascading web of protein signal pathways, the p38 MAPK protein kinase will have an effect on around 10 other neighboring proteins and compounds.

At this point, I have decided to end my detailed study on the MAPK/ERK signaling pathway here because the details I feel at not important at this stage of the research. Maybe later at some point this post and my knowledge on signaling pathways will be needed to be updated and improved upon.

From the Biocarta website I found another picture for analysis (source HERE) below…


{Tyler-Related Paper:

ERK1 and ERK2 regulate chondrocyte terminal differentiation during endochondral bone formation.

“Chondrocytes in the epiphyseal cartilage undergo terminal differentiation prior to their removal through apoptosis. To examine the role of ERK1 and ERK2 in chondrocyte terminal differentiation, we generated Osterix (Osx)-Cre; ERK1(-/-) ; ERK2(flox/flox) mice (conditional knockout Osx [cKOosx]), in which ERK1 and ERK2 were deleted in hypertrophic chondrocytes. These cKOosx mice were grossly normal in size at birth, but by 3 weeks of age exhibited shorter long bones. Histological analysis in these mice revealed that the zone of hypertrophic chondrocytes in the growth plate was markedly expanded. In situ hybridization and quantitative real-time PCR analyses demonstrated that Matrix metalloproteinase-13 (Mmp13) and Osteopontin expression was significantly decreased, indicating impaired chondrocyte terminal differentiation. Moreover, Egr1 and Egr2, transcription factors whose expression is restricted to the last layers of hypertrophic chondrocytes in wild-type mice, were also strongly downregulated in these cKOosx mice. In transient transfection experiments in the RCS rat chondrosarcoma cell line, the expression of Egr1, Egr2, or a constitutively active mutant of MEK1 increased the activity of an Osteopontin promoter, whereas the MEK1-induced activation of the Osteopontin promoter was inhibited by the coexpression of Nab2, an Egr1 and Egr2 co-repressor. These results suggest that MEK1-ERK signaling activates the Osteopontin promoter in part through Egr1 and Egr2. Finally, our histological analysis of cKOosx mice demonstrated enchondroma-like lesions in the bone marrow that are reminiscent of human metachondromatosis, a skeletal disorder caused by mutations in PTPN11. Our observations suggest that the development of enchondromas in metachondromatosis may be caused by reduced extracellular signal-regulated kinase/mitogen-activated protein kinase (ERK MAPK) signaling.”

Product Review XIV: InstaHEIGHT Super Massing And InstaHeight.Com

Me: I had posted recently about the fact that I have had many free copies of E-Products available for download in the “downloads” section of the website and I mentioned that I had at least an old copy of the E-Product “Grow Taller 4 Idiots”. One of the regular readers expressed his opinion on the product and another reader responded to the one reader and mentioned about this website and product which I have not seen before which links to a website instaheight.com. I got a chance to look at it earlier today. From a first glance, it was clear that this website was to sell another height increase E-Product. 

Since I have not done a product review in a while, I guess I wanted to do a slightly more detailed analysis on this product before making any judgements. The first thing I notice is that the page is a very long sales page. I scroll down to the bottom and see that there is 2 height increase products being sold with a third E-Book added on Strength Training. The three products are…

1. 10 Steps To Extra Height – Inch Adding, Get Taller Today – Authors: Deavon Stoller &

2. Human Growth Hormone – HGH Explained, Understanding InstaHEIGHT Super Massing – Authors: Deavon Stoller & 

3. Darren O’ Connell – Training For Power And Strength – Author: Deaven Stoller &

All the products are copyrighted on 2009. At the bottom they lowered the price of these 3 products from $97 to $67.

If you actually click on the download button, you realize that the 3 E-Products are stuff you get from the biggest E-Product market place on the net, Clickbank. I personally have never trusted any of the products that is exchanged on Clickbank personally because I used to be part of that IM community.

First, right off the bat they make two stupid mistakes.

1. They said that the average height of Korean men is 5′ 4″. If they were talking about North Koreans, then they are right but the average height of South Korean men is actually around 5′ 9″-5′ 10″. Why would this website want to show the average height of North Korean soldiers when the nations they were talking about was on the Polish, Chinese, and Vietnamese soldiers.

2. The picture they have on Mia Ku in 1997 may be 5′ 7″ but the picture next to her is NOT Mia Ku in 200 but of Dana Torres, Olympic medalist who is well known to be 5′ 11.5″ . They are not the same person.

The Science/Theory: It seems that the people who wrote the book are trying two ways to make you taller: One way is to thicken the cartilage disks in your vertebrate. If I remember correctly though at adult stages, there is very little cartilage if there is any at all. From our studies we  remember that the disks are not really made of cartilage, but a collagenous fibrous material. You have the vertebrate bone that is attached to ligaments which are attached to the outer and inner collagenous material. If there was any cartilage left it would be at the very outer edges. The other way that the products talks about is from “how to stimulate the growth platelets on a cellular level and where the easiest and quickest activity occurs”. I am not familiar with the possibility of using growth platelets on a cellular level. I know there are growth factors that are platelet derived but I have not done enough research on this type of growth factor yet. The idea they are talking about Super Massing is as  they describe it “The stress applied to the body is not to build muscle but to ignite the body to release HGH”. As we already know excess HGH release will only cause extremity and facial features who enlarge after growth plate closure.

There is two big claims from the webpage which I found to be rather incredible. They are

1. Our employee Sung Xiavi works remotely in China and her full time job is at the “secratariate commission of the peoples health”. She mentioned the document in one of our podcast business meetings and we took the opportunity to access the materials with her translation efforts. This material is high classed confidential government information.

2. Does it really increase penis size in men?

Yes, in all cases, the genitals including the testicles grow in volume and size. In men this process produces much testosterone naturally which is the main driver of genital size. An increase in the genitals in men is a typical outcome along with the height gains.

Also, at the bottom is a disclaimer with this message…

Disclaimer

Every effort is made to provide completely accurate and fully disclosed information. However, this disclaimer immunes howtoget-taller.com, its management, owners and affiliates and distributors from all claims.  Errors or ommissions are always possible and and we cannot warrant this website or any parts of the said (Product) to be free from said errors or ommissions. Your are advised to always seek medical advice in regards to any changes in your diet or exercise program to ascertain your fitness for it. We cannot possibly assess each purchaser for the capacity or fitness to do the advised work in the method to grow taller, so for this reason we disclam all liability and it is a term and condition of use that you understand this material is provided “as is” and does not include a fitness examination of any kind.
Me: So I typed in the website url howtoget-taller.com to see what was on that site. The site leads me to another site that sells the same 3 E-Products. The person to contact on this website is Theodore T. Hunger. it would seem that this other website is a part of an affiliate marketing group. They claim this…
From the instaHEIGHT website
Help us share this remarkable information and make a good automated income too for yourself…IT’S EASY AND FREE!

The InstaHEIGHT Super Massing package is the new buzz and you can take this free opportunity to get in too. FREE! It’s easy and will take you a few minutes to get started. 

Existing affiliates are making $3000 to $5000 a week with us on auto pilot. We do all the work, the product delivery and handle all support issues. All you have to do is place your clickbank identifier link on your website and let your visitors click it.  We do the rest. you get a whopping $30 dollars per sale!!

  • If you sent 100 visitors a day, you will make 16 sales a day. $480 dollars a day or $3300 a week 
  • If you send 1000 visitors a day, you will make 160 sales a day $4800 dollars a day or $33,000 a week
  • If you send 10,000 visitors a day, you will make 1600 sales a day $48000 a day or $330,000 a week!
Me: So this website says that if I can send 100 people to the website a day I will make $3300 a week? For 10,000 people a day I will make more than even CEOs of fortune 500 companies. Really? This sounds like an Amway Multi-Level Marketing Seminar I once was tricked into going to. Final Conclusion: Another one of those E-Products scams that don’t work for adults and want your money.

Analysis On The Possible Cause For Height Increase During Pregnancy

Me: I was planning on moving onto another subject in my posts when Tyler sent me a message asking if I could do slightly more research on what could be causing these women to get taller. So here is my attempt to understand and guess at the cause.

What we know right now is that there is a decent percentage of women who found that they have grown in height during and after pregnancy. If I was to take a guess at the rate or percentage, it could be as low as 1 out of 10,000 women or even as high as 1 out of every 100 women, so my guess is that it is probably around 0.01%-1% . I don’t believe that this type of thing can happen that much more prevalently. However, any case of height increase in anyone past the normal age of maturity is an interesting case to look into.

Feet Size Increase

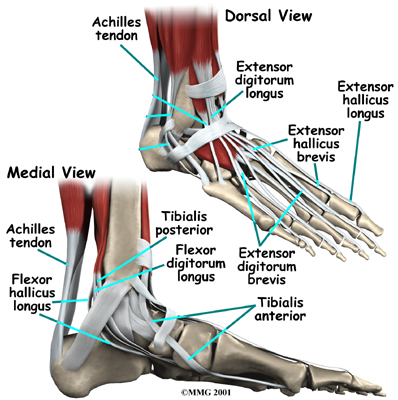
What we know is that the phenomena of feet expanding and the need to buy bigger shoes is a commonly cited and found in pregnancy guides. If it was really just the muscle relaxing, then it should only cause the feet to get wider, not longer. However there are women who said that their shoe size went up by 2-3 sizes. Most women’s shoes that I know have also extra wide variations. This means that technically women don’t need to switch to a higher size, since size is defined by length, not wide. The width of one’s feet can be switch in shoes with Extra Wide pairs. Of course we could say that the feet just got proportionately bigger, in width and length. That would make more sense but the increase of shoe size by 3 shoe sizes is beyond what i could imagine swelling can do, especially since the feet never shrink back in size after the pregnancy. 1 shoe size increase is about 0.5 cm in extra length. That means that a 3 size increase is a 1.5 cm increase in feet length. From the picture on the right (found from source HERE) I guess it might be possible for the feet’s ligaments to relax enough to cause even 1 cm of length increase.

Hands Size Increase

From links like HERE we know that many women during pregnancy can’t wear their wedding rings. Since the ring must always overcome the diameter of the knuckle joints, it makes sense that what is really blocking the fingers from the ring are the knuckles. The knuckles have become swollen and enlarged. If the entire finger has swelled , then that is the result of the muscle relaxant. If the reason the ring can’t get there is only from the knuckles, we can say that the pregnancy is doing something to the joints, specifically the cartilage at the synovial joints in the metacarpals of the hands. Using this type of logic we can say that it is possible the height increase was from a pregnancy induced swelling of the articular cartilage on synovial joints in general. It is a very common thing for pregnant women to notice pain and swelling in their ankles and wrists.

Height Increase

If we assume the hormone/endocrinology reason for the height increase, we have to see what types of hormones could cause this. From this link HERE…we can see a list of all the major hormones which are involved in pregnancy.

Hormones Secretion by Main function (effect of hormone)
Progesterone Chorion after 6 weeks
Corpus Luteum in first 3-4 months
Placenta after 3 months
Maintains lining of uterus for implantation
Prepares mammary glands for lactatio
Stimulates aldosterone secretion from adrenal cortex
Oestrogen Chorion after 3-4 weeks
Corpus Luteum in first 3-4 months
Placenta after 3 months
Works with progesterone for endometrium maintenance and mammary gland preparation
Increases protein synthesis
Lowers blood cholesterol level
Inhibits action of prolactin on mammary glands
HCG Chorion directly after implantation
sharp increase -> peaks at 9 weeks -> decreases until birth
Stops degeneration of corpus luteum
Acts as an indication of pregnancy in urine sample pregnancy tests
Allows gonadotropins to enter the foetal blood to premote sexual differentiation of the foetus
Relaxin Corpus Luteum
Placenta after 3 months
Increases flexibility of pubic symphysis and ligaments of pelvis
Relaxation of Myometrium
Dilates cervix during labour
HPL Chorion Allows active transport of amino acids and glucose from maternal to the foetal blood
Makes free fatty acids available for the mother as an energy source
Prepares mammary glands for lactation
CRH Placenta Timing of birth
Stimulates adrenal cortex to secrete cortisol and aldosterone
Anterior Pituitary Hormones Presence of progesterone and oestrogen Increase prolactin secretion- stimulates milk secretion
Decrease growth hormone secretion
Decreases ACTH and TSH (gonadotropins) secretion

What I notice right away is that the Progesterone and O-estrogen are produce from the same location as Natural Growth Hormones. However it is also noted that during pregnancy the GH secretion decreases.

Note: What is critical to realize is that during pregnancy most women are not thinking about their height at all so even if they did increase in height, they would never realize it since they are too preoccupied with other issues, like pain, swollen joints, nausea, mood swings, etc. Height is the last thing on a pregnant woman’s mind. This might pin-point to the idea that it could be that height  increase might be slightly more common than reported. 


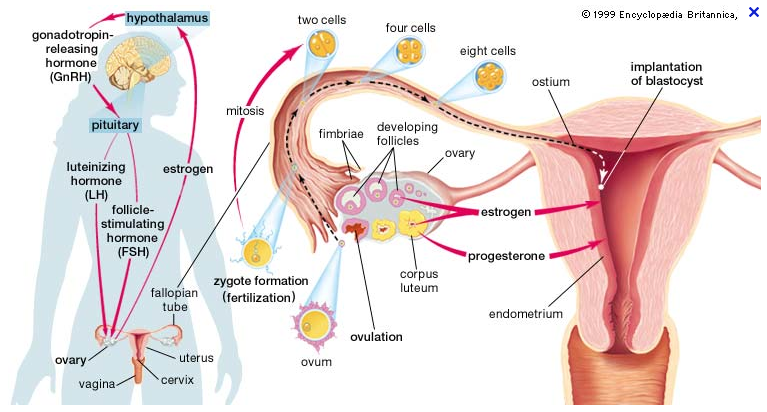
If we use the diagram on the left (from HERE) we notice that the Luteinizing Hormone (LH) and Follicle-Stimulating Hormone (FSH) are both produced from the pituitary gland at around the anterior pituitary region just like the GH pathway.

I remember that the FSH is a type of growth hormone. FSH regulates the development, growth, pubertal maturation, and reproductive processes of the body.

Using the wiki article on FSH located HERE we see that high levels of FSH can lead to Klinefelter’s syndrome. What is amazing is that I have found a few PubMed articles that show that people who have Klinefelter’s syndrome exhibit tall stature. I was actually going o write up a post relating Klinefelter’ syndrome with height since there is a big connection.

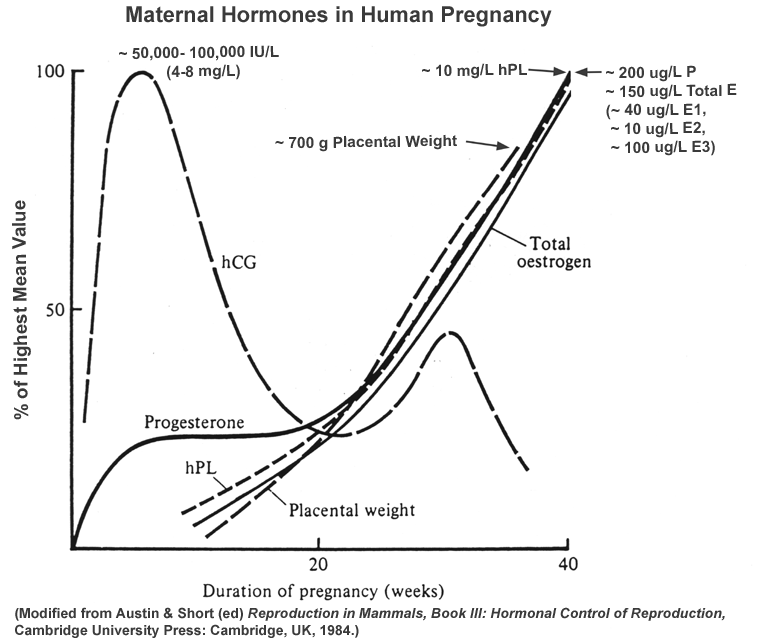
From the diagram on the right (found HERE) we can see that the release and rate of release of the major hormones during the time intervals of pregnancy, assuming a 9.5 month gestation cycle.

I am going to have to use a little bit of elementary physics to explain my reasoning for the next part. In general, the way many phenomena can be explained in nature is through differential equations, which one can solve usually using approximation methods to model dynamic behavior of the world around us. This is why the exponential function is so commonly seen in nature, since the differential and integral function of the exponential is the exponential itself.

Both newton’s original motion laws and einstein’s general theory of relativity showed that a rate that is constant will not produce changes, but require a change in rate.

When looking at this diagram, I would guess that the only time and range which height increase probably would happen is during a interval where the hormone release rate increased, which implies a change of a change, or an acceleration. Looking at the diagram, I really have only one small fact to go off of which is that one mother said that her height was measured from the 12th week with no height change and her height was measured in the 22 week and she saw an increase of 2.5 inches. If we look at the graph to see whether there are any hormones which saw an increase in rate of release (aka acceleration) which in calculus terms is what is known as a concave inflection point moving upwards. The graphs seems to suggest that it is either the O-estrogen or the progesterone.

Note: I will look at the possible connection between progesterone and o-estrogen and height and growth in another post. 

From this ParentDish.Co we learn that during pregnancy a lot of the Calcium in the mother’s system gets absorbed by the baby. Teeth loss and bleeding gums are very common. This might help explain the height increase. Maybe one of the only ways to increase height is to make the bones weaker by removing the calcium hypoxilates. from the same source link I quote this “Rachel agrees: “My ribcage expanded after my first pregnancy, and some of my bras and dresses are too tight across there now.””. This seems to suggest that maybe the hormones can get into whatever cartilage or even bones and get them to get bigger somehow. We learned from a previous post that the cartilage in the sternum ossify far later than the growth plate cartilage in the limbs. This women might have had her cartilage in the sternum increase in size.

Further Analysis: From using what little information I could gather, it seems that women who experience the height increase are usually shorter than average with the forum posts saying they were around the 5’0-5’3″ mark. One women said it was not her torso which increased in length. Many said they say height gain in their 3rd pregnancy, others in their first pregnancy. One commented her height increase happened only when she was giving birth to her only daughter. One women said that her gain was around the 12-22 week time period.

Theory 1: If I was to guess I would say that the phenomena is actually catch up growth at work. These women who are shorter than average had stunted growth. Since O-estrogen and progesterone has been used in traditional history for tall girls to stop growth, they are just like extrados and estrogen. They cause a boost in the aging process of growth plates. I can assume that the growth plates for the short females never fully sealed. The increase shot of progesterone and o-estrogen release into the body caused the growth plates to give the last lurch in longitudinal growth from whatever chondrocytes were still around the little bit of growth plate that was left.

Theory 2: The edema they develop causes so much extra water to go into their synovial joints swelling everything up. The swelling of water (in knees and ankles) gets into the articular cartilage. Remember that salt causes edema to happen since the water molecule moves from higher water concentration to lower water molecule concentration (from source HERE). Somehow one of the pregnancy hormones gets more salt into the cartilage and the water goes in the cartilage causing it to expand. The expansion might get into any chondrocytes in the articular cartilage and get them to hypertrophy which floats randomly and sometimes get to the one epiphysis bone surface. The progesterone comes along and takes some of the chondrocytes and ossify them leading to longitudinal growth. Of course this is all assuming that there are still come chondrocytes still in the articular cartilage and the randomness is not completely random but is more prone to land on the bone surface, and that the blood vessels supplying to the cartilage ends can reach to the hypertrophic chondrocytes.